This function constructs a line guide primitive.
Usage
primitive_line(key = NULL, cap = "none", theme = NULL, position = waiver())Arguments
- key
A standard key specification. See more information in the linked topic.
- cap
A method to cap the axes. One of the following:
A
<character[1]>with one of the following:"none"to perform no capping."both"to cap the line at both ends at the most extreme breaks."upper"to cap the line at the upper extreme break."lower"to cap the line at the lower extreme break.
A
<logical>[1], whereTRUEis equivalent to"both"andFALSEis equivalent to"none"in the options above.A sorted
<numeric>[2n]with an even number of members. The lines will be drawn between every odd-even pair.A
<function>that takes the scale's breaks as the first argument, the scale's limits as the second argument and returns a<numeric>[2n]as described above.
- theme
A
<theme>object to style the guide individually or differently from the plot's theme settings. Thethemeargument in the guide overrides and is combined with the plot's theme.- position
A
<character[1]>giving the location of the guide. Can be one of"top","bottom","left"or"right".
Details
Styling options
Below are the theme options that determine the styling of this guide, which may differ depending on whether the guide is used in an axis or in a legend context.
| Theme setting | Context | Type | Description |
axis.line.{x/y}.{position} | Axis | element_line() | The axis line. |
legend.axis.line | Legend | element_line() | The axis line. |
There are no other styling options.
The context-agnostic alternative to using theme() is to use
theme_guide():
primitive_line(theme = theme_guide(
  line = element_line()
))Examples
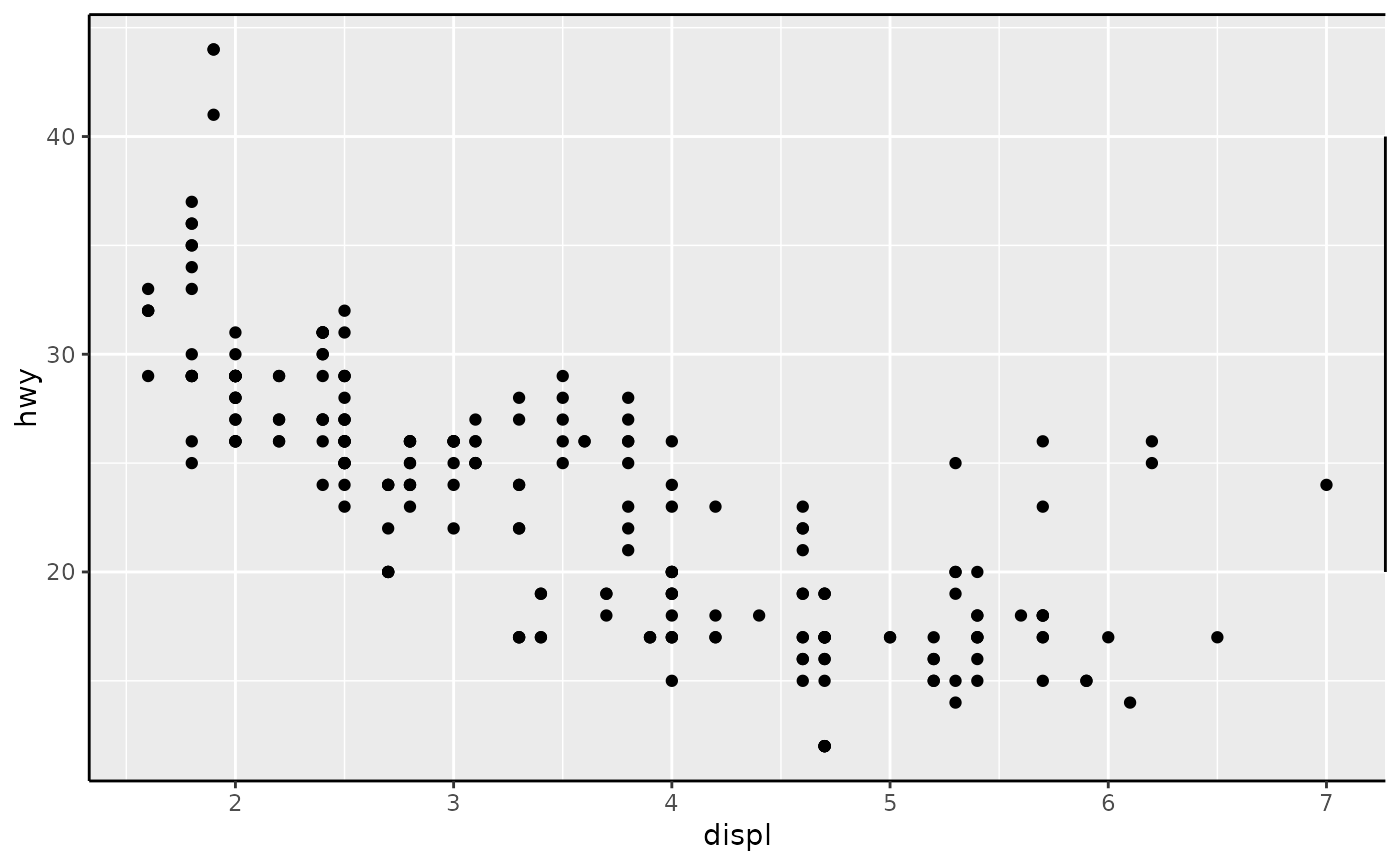
# A standard plot
p <- ggplot(mpg, aes(displ, hwy)) +
  geom_point() +
  theme(axis.line = element_line())

# Adding as secondary guides
p + guides(
  x.sec = primitive_line(),
  y.sec = primitive_line(cap = "both")
)