This function constructs a boxes guide primitive.
Arguments
- key
A range key specification. See more information in the linked topic.
- angle
A specification for the text angle. Compared to setting the
angleargument inelement_text(), this argument uses some heuristics to automatically pick thehjustandvjustthat you probably want. Can be one of the following:NULLto take angles and justification settings directly from the theme.waiver()to allow reasonable defaults in special cases.A
<numeric[1]>between -360 and 360 for the text angle in degrees.
- oob
A method for dealing with out-of-bounds (oob) ranges. Can be one of
"squish","censor"or"none".- drop_zero
A
<logical[1]>whether to drop near-zero width ranges (TRUE, default) or preserve them (FALSE).- pad_discrete
A
<numeric[1]>giving the amount ranges should be extended when given as a discrete variable. This is applied after thedrop_zerosetting.- min_size
A [
<grid::unit[1]>][grid::unit] setting the minimal size of a box.- levels_box
A list of
<element_rect>objects to customise how boxes appear at every level.- levels_text
A list of
<element_text>objects to customise how text appears at every level.- theme
A
<theme>object to style the guide individually or differently from the plot's theme settings. Thethemeargument in the guide overrides and is combined with the plot's theme.- position
A
<character[1]>giving the location of the guide. Can be one of"top","bottom","left"or"right".
Details
Styling options
Below are the theme options that determine the styling of this guide, which may differ depending on whether the guide is used in an axis or in a legend context.
The possible {position} suffixes mentioned below are x, x.top,
x.bottom, y, y.left, y.right. The theta and r position suffixes
in ggplot2 are not obeyed in legendry.
| Theme setting | Context | Type | Description |
legendry.box | Both | element_rect() | The boxes themselves |
axis.text.{position}\* | Axis | element_text() | The text in the boxes. |
legend.text | Legend | element_text() | The text in the boxes. |
Styling options per level can be set in the levels_box and levels_text
arguments. These override theme settings.
Styling options per range can be set in the range key.
The rect and text prefixed properties are prioritised for the boxes and
text respectively. These override theme settings and 'per level' settings.
The context-agnostic alternative to using theme() is to use
theme_guide():
primitive_box(theme = theme_guide(
  box = element_rect(),
  text = element_text()
))Examples
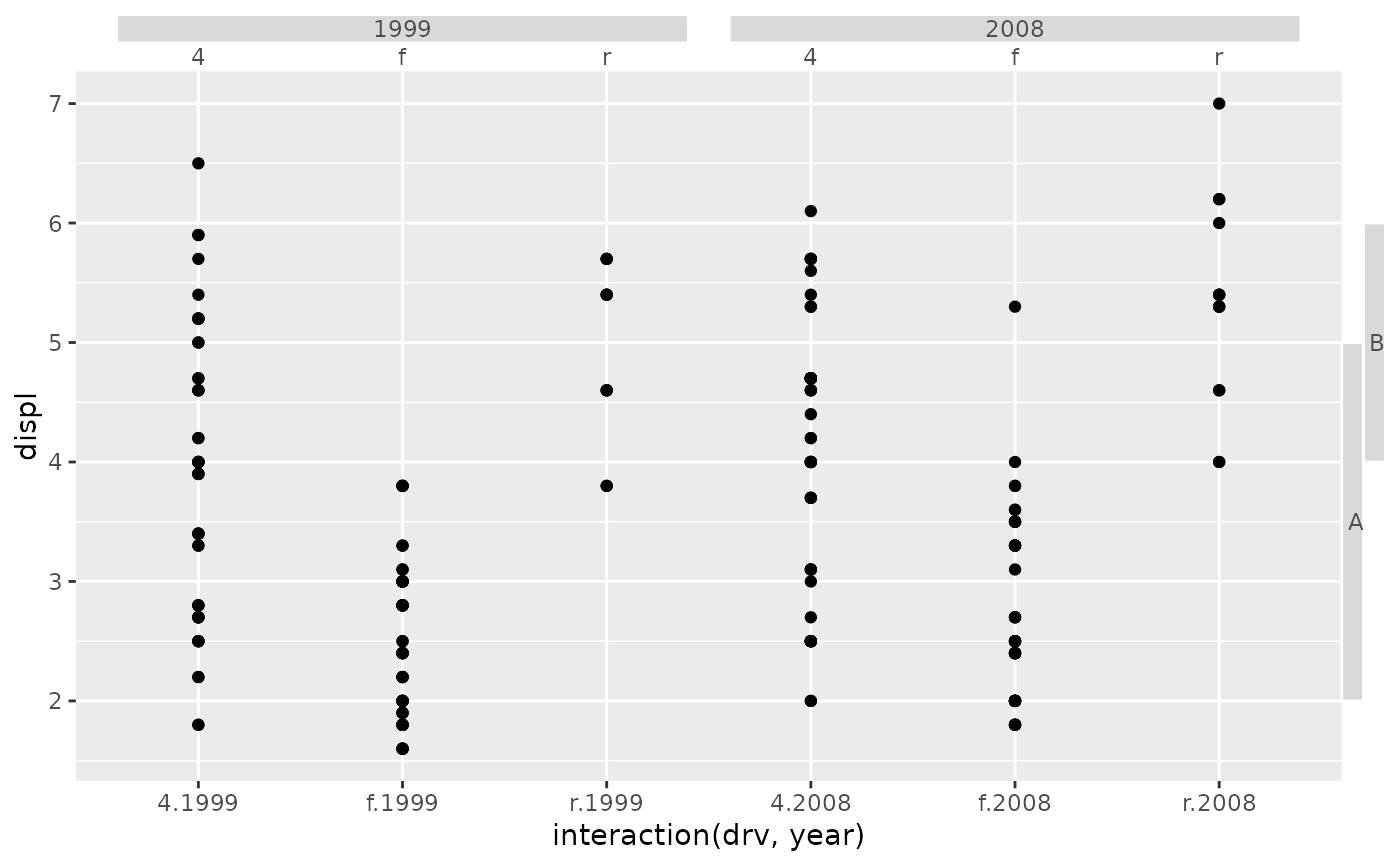
# A standard plot
p <- ggplot(mpg, aes(interaction(drv, year), displ)) +
 geom_point()

key <- key_range_manual(c(2, 4), c(5, 6), c("A", "B"))

# Adding as secondary guides
p + guides(
  x.sec = primitive_box(),
  y.sec = primitive_box(key = key)
)