![[Experimental]](figures/lifecycle-experimental.svg)
This is a guide that displays user-defined keys independent of scales. It should only be used as a last resort when struggling to format a conventional legend.
Usage
guide_legend_manual(
  labels,
  ...,
  layers = list(geom_point()),
  title = NULL,
  theme = NULL,
  design = NULL,
  nrow = NULL,
  ncol = NULL,
  reverse = FALSE,
  position = NULL,
  direction = NULL,
  order = 0L
)
Arguments
- labels
Labels to display next to the keys. Can be a
<character>or<expression>vector to set labels, orNULLto draw no labels.- ...
Arguments interpreted as aesthetics. For example:
colour = "red". The aesthetics must have the same size as thelabelsargument, or have size 1. These aesthetics may be overruled by fixed aesthetics set in thelayersargument.- layers
A
<list>of layers (<LayerInstance>objects) created by thegeom_*()orstat_*()family of functions. These layers are used for theirkey_glyphdrawing functions, as well as to populate default aesthetics. Any fixed aesthetics provided to these layers overrule aesthetics passed to the...argument.- title
One of the following to indicate the title of the guide:
- theme
A
<theme>object to style the guide individually or differently from the plot's theme settings. Thethemeargument in the guide overrides and is combined with the plot's theme.- design
Specification of the legend layout. One of the following:
NULL(default) to use the layout algorithm ofguide_legend().A
<character[1]>string representing a cell layout wherein#defines an empty cell. See examples.A
<matrix[n, m]>representing a cell layout whereinNAdefines an empty cell. See examples. Non-string atomic vectors will be treated withas.matrix().
- nrow, ncol
A positive
<integer[1]>setting the desired dimensions of the legend layout. WhenNULL(default), the dimensions will be derived from thedesignargument or fit to match the number of keys.- reverse
A
<logical[1]>whether the order of keys should be inverted.- position
A
<character[1]>giving the location of the guide. Can be one of"top","bottom","left"or"right".- direction
A
<character[1]>indicating the direction of the guide. Can be on of"horizontal"or"vertical".- order
A positive
<integer[1]>that specifies the order of this guide among multiple guides. This controls in which order guides are merged if there are multiple guides for the same position. If0(default), the order is determined by a hashing indicative settings of a guide.
Details
Because this guide is not tied to a scale, it can be given an arbitrary name
in guides(); as long as it doesn't clash with other aesthetics.
Styling options
Below are the theme options that determine the styling of this guide.
| Theme setting | Type | Description |
legend.background | element_rect() | Background of the legend. |
legend.margin | margin() | Padding around the legend. |
legend.text | element_text() | Labels displayed next to keys. |
legend.text.position | <character[1]> | One of "top", "right", "bottom" or "left". |
legend.title | element_text() | Title of the legend. |
legend.title.position | <character[1]> | One of "top", "right", "bottom" or "left". |
legend.key | element_rect() | Background of the key areas. |
legend.key.height | unit() | Height of keys. |
legend.key.width | unit() | Width of keys. |
legend.key.justification | <numeric[2]> | Justification for placing legend keys in excess space. |
legend.key.spacing.x | unit() | Horizontal spacing between keys. |
legend.key.spacing.y | unit() | Vertical spacing between keys. Taken literally. |
legend.byrow | <logical[1]> | Row-order key filling (TRUE) or column-order (FALSE) |
The context-agnostic alternative to using theme() is to use
theme_guide():
guide_legend_manual(legend_args = list(theme = theme_guide(
  text = element_text(),
  text.position = "right",
  title = element_text(),
  title.position = "top",
  key = element_rect(),
  key.height = unit(5, "mm"),
  key.width = unit(5, "mm"),
  key.justification = c(0.5, 0.5),
  key.spacing.x = unit(5, "mm"),
  key.spacing.y = unit(5, "mm"),
  margin = margin(5),
  background = element_rect(),
)))
See also
Other standalone guides:
guide_axis_annotation(),
guide_axis_base(),
guide_axis_dendro(),
guide_axis_nested(),
guide_axis_plot(),
guide_axis_symbols(),
guide_circles(),
guide_colbar(),
guide_colring(),
guide_colsteps(),
guide_legend_base(),
guide_legend_cross(),
guide_legend_group()
Other legend guides:
guide_legend_base(),
guide_legend_cross(),
guide_legend_group()
Examples
# A standard plot
p <- ggplot(mtcars, aes(disp, mpg)) +
geom_point()
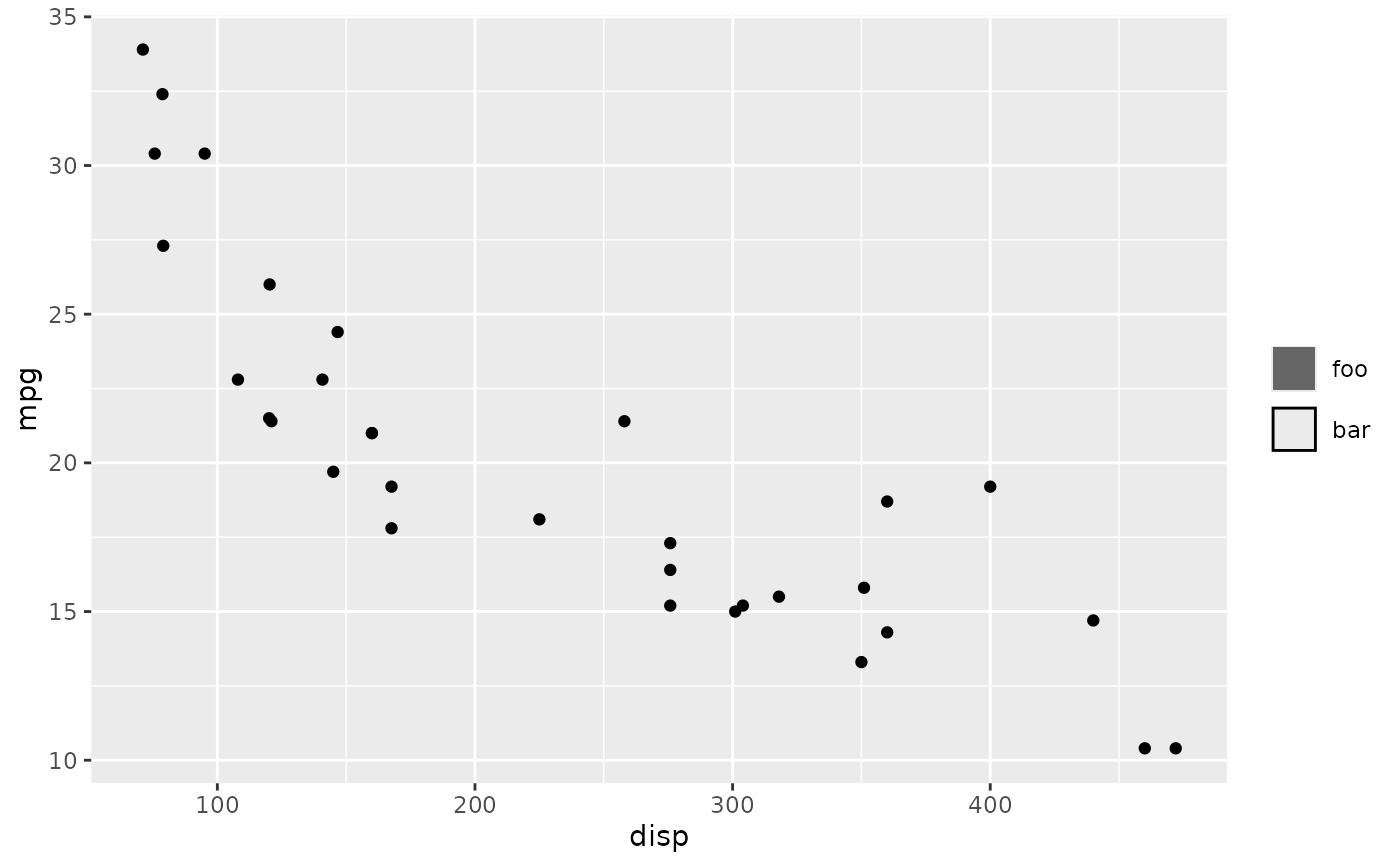
# Typical usage: set `label` and some aesthetics
p + guides(
some_name = guide_legend_manual(
label = c("foo", "bar"),
colour = c(NA, "black"),
fill = c("grey40", NA),
layers = geom_col()
)
)
 # Alternative: use `layers` to set aesthetics
p + guides(
some_name = guide_legend_manual(
label = c("foo", "bar"),
layers = geom_col(
# Must match length of `label`
colour = c(NA, "black"),
fill = c("grey40", NA)
)
)
)
# Alternative: use `layers` to set aesthetics
p + guides(
some_name = guide_legend_manual(
label = c("foo", "bar"),
layers = geom_col(
# Must match length of `label`
colour = c(NA, "black"),
fill = c("grey40", NA)
)
)
)
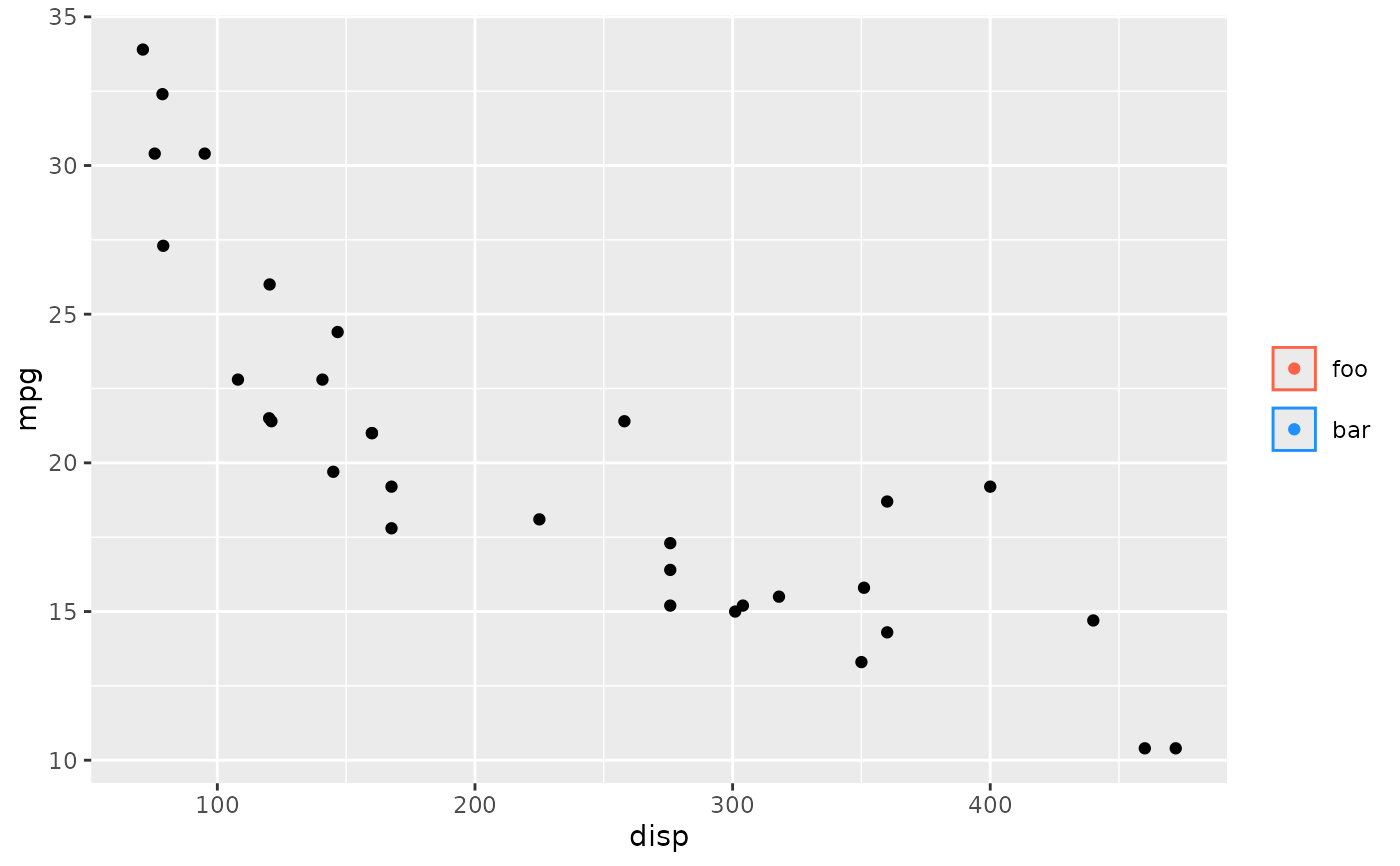
 # You can use >1 layer
p + guides(
some_name = guide_legend_manual(
label = c("foo", "bar"),
colour = c("tomato", "dodgerblue"),
fill = NA,
layers = list(geom_col(), geom_point())
)
)
# You can use >1 layer
p + guides(
some_name = guide_legend_manual(
label = c("foo", "bar"),
colour = c("tomato", "dodgerblue"),
fill = NA,
layers = list(geom_col(), geom_point())
)
)