This guide displays the sizes of points as a series of circles. It is
typically paired with geom_point() with
draw_key_point() glyphs.
Arguments
- key
A standard key specification. Defaults to
key_auto(). See more information in the linked topic.- title
One of the following to indicate the title of the guide:
- theme
A
<theme>object to style the guide individually or differently from the plot's theme settings. Thethemeargument in the guide overrides and is combined with the plot's theme.- hjust, vjust
A
<numeric[1]>between 0 and 1 giving the horizontal and vertical justification, respectively, of the central shapes. It is recommendedhjust = 0.5when text is placed on the left or right andvjust = 0.5is recommended when text is placed on top or in the bottom.- text_position
A string, one of
"ontop","top","right","bottom", or"left"do describe the placement of labels. The default (NULL), will take thelegend.text.positiontheme setting.- clip_text
A
<logical[1]>whether to give text in the"ontop"position a small rectangle of background colour.- override.aes
A named
<list>specifying aesthetic parameters of the key glyphs. See details and examples inguide_legend().- position
A
<character[1]>giving the location of the guide. Can be one of"top","bottom","left"or"right".- direction
A
<character[1]>indicating the direction of the guide. Can be on of"horizontal"or"vertical".
Details
Please note that the default size scales scale to area, not radius, so equidistant breaks will appear at irregularly spaced positions due to labelling the diameter of a circle.
This graph was designed with standard round shapes
in mind, i.e. shapes 1, 16, 19 and 21. For that reason, shape = 1 is the
default override.aes argument. Other shapes will probably be drawn but the
quality of their alignment and label placement may be unsatisfactory.
Styling options
Below are the theme options that determine the styling of this guide.
| Theme setting | Type | Description |
legend.background | element_rect() | Background of the legend. |
legend.margin | margin() | Padding around the legend. |
legend.key | element_rect() | Background of the key area underneath circles. |
legend.text | element_text() | Labels displayed next to tick marks or on top of circles. |
legendry.legend.key.margin | margin() | Padding between circles and edge of key area. |
legend.ticks | element_line() | Tick marks connecting circle to label. |
legend.title | element_text() | Title of the legend. |
legend.title.position | <character[1]> | One of "top", "right", "bottom" or "left". |
Styling options per break can be set in the standard key. These override theme settings.
The context-agnostic alternative to using theme() is to use
theme_guide():
guide_circles(theme = theme_guide(
  text = element_text(),
  title = element_text(),
  title.position = "top",
  margin = margin(5),
  key = element_rect(),
  key.margin = margin(5),
  background = element_rect(),
  ticks = element_line(),
))Examples
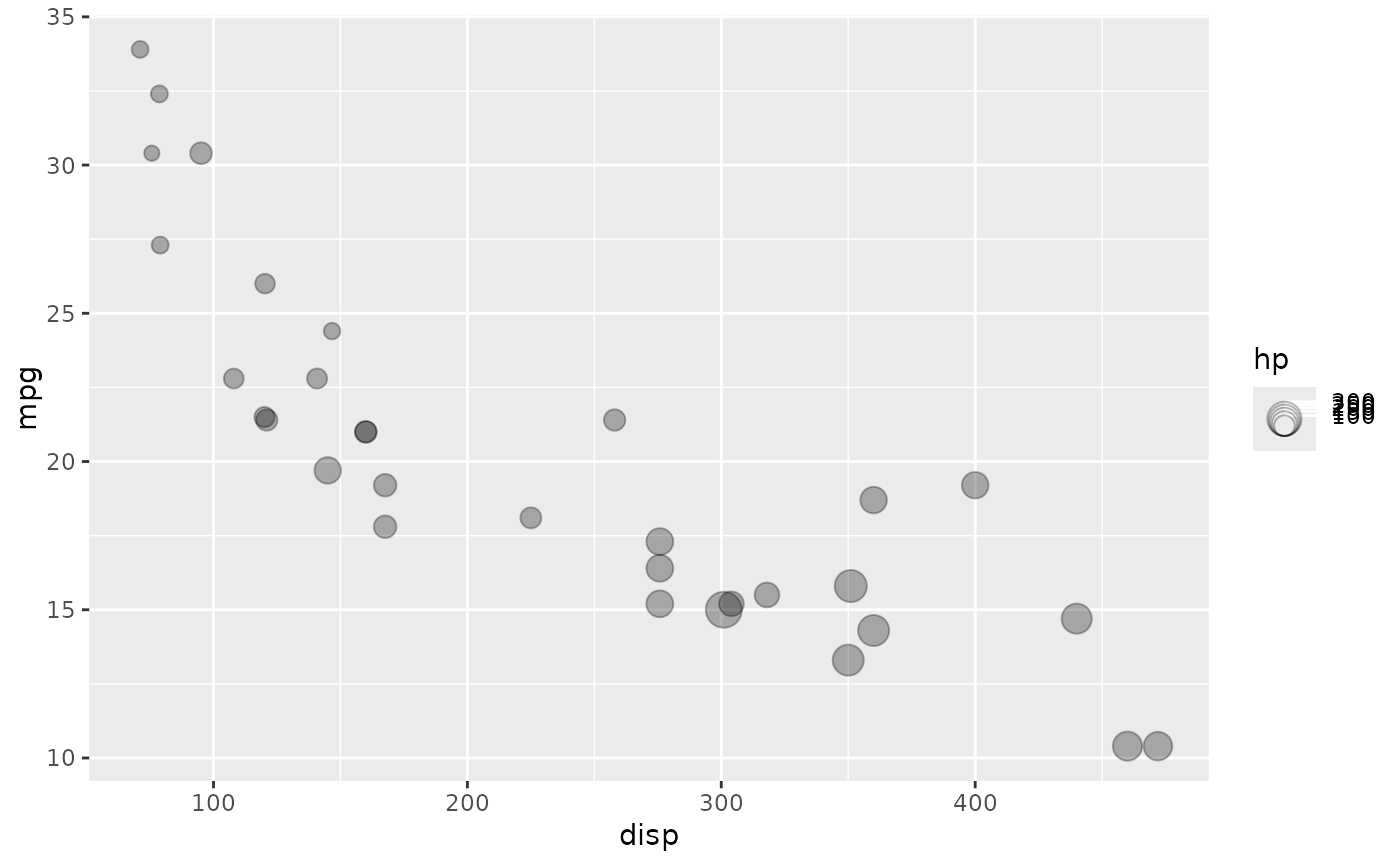
# A standard plot
p <- ggplot(mtcars, aes(disp, mpg)) +
geom_point(aes(size = hp), alpha = 0.3)
# By default, the sizes aren't large enough to make this guide clear
p + scale_size_area(guide = "circles")
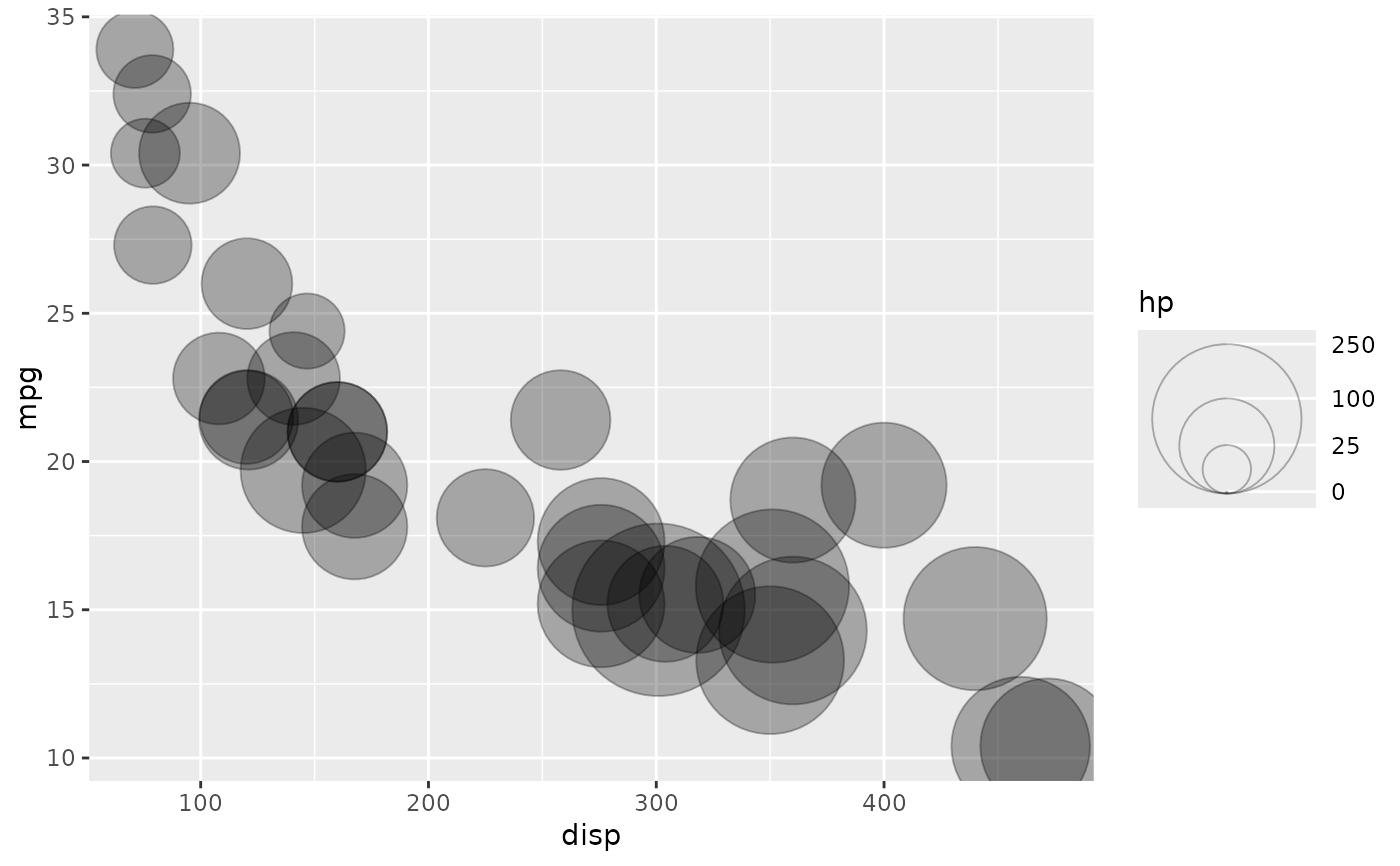
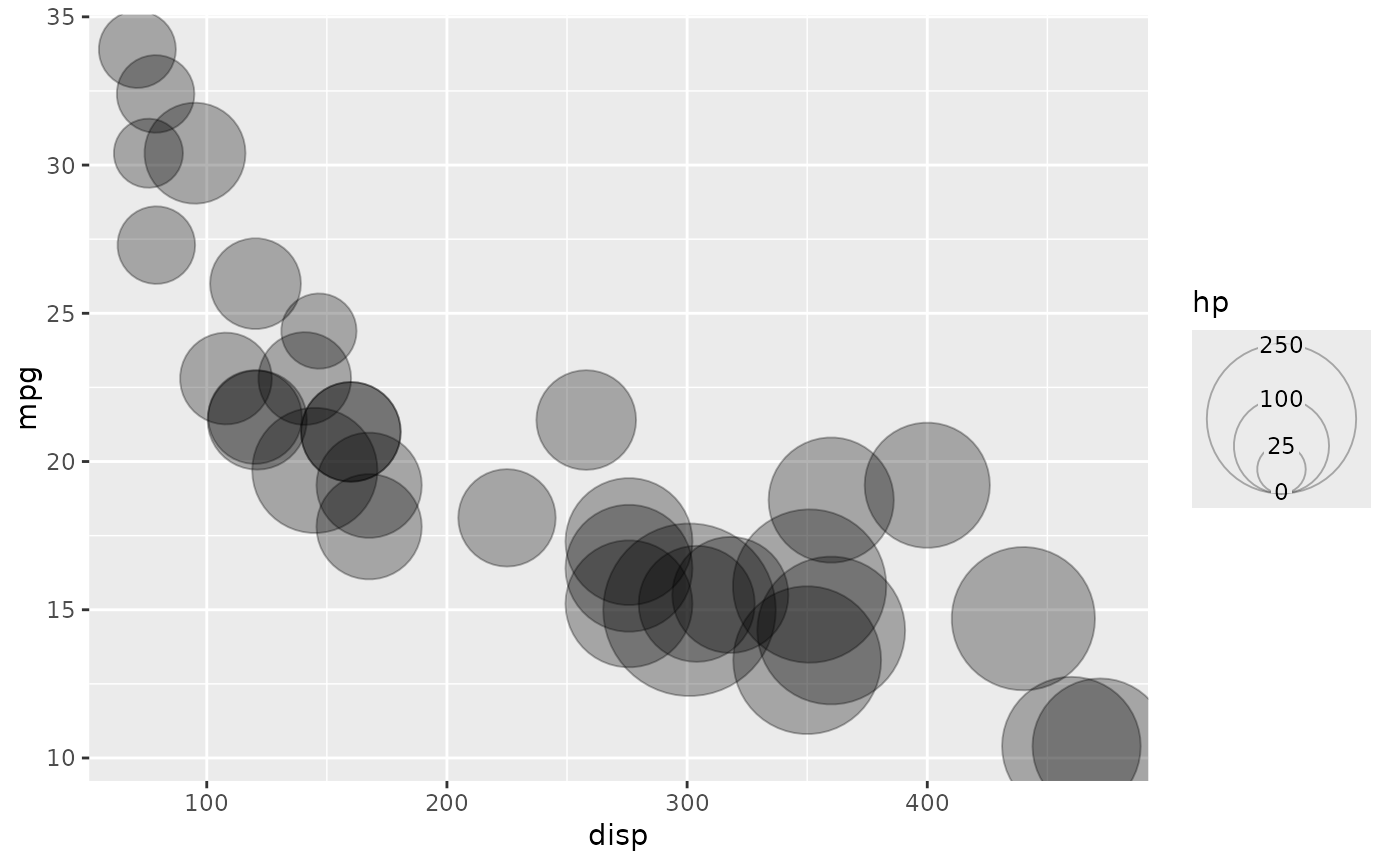
 # Update with a more approrpriate scale
p <- p +
scale_size_area(
max_size = 30,
limits = c(0, NA),
breaks = c(0, 25, 100, 250)
)
p + guides(size = "circles")
# Update with a more approrpriate scale
p <- p +
scale_size_area(
max_size = 30,
limits = c(0, NA),
breaks = c(0, 25, 100, 250)
)
p + guides(size = "circles")
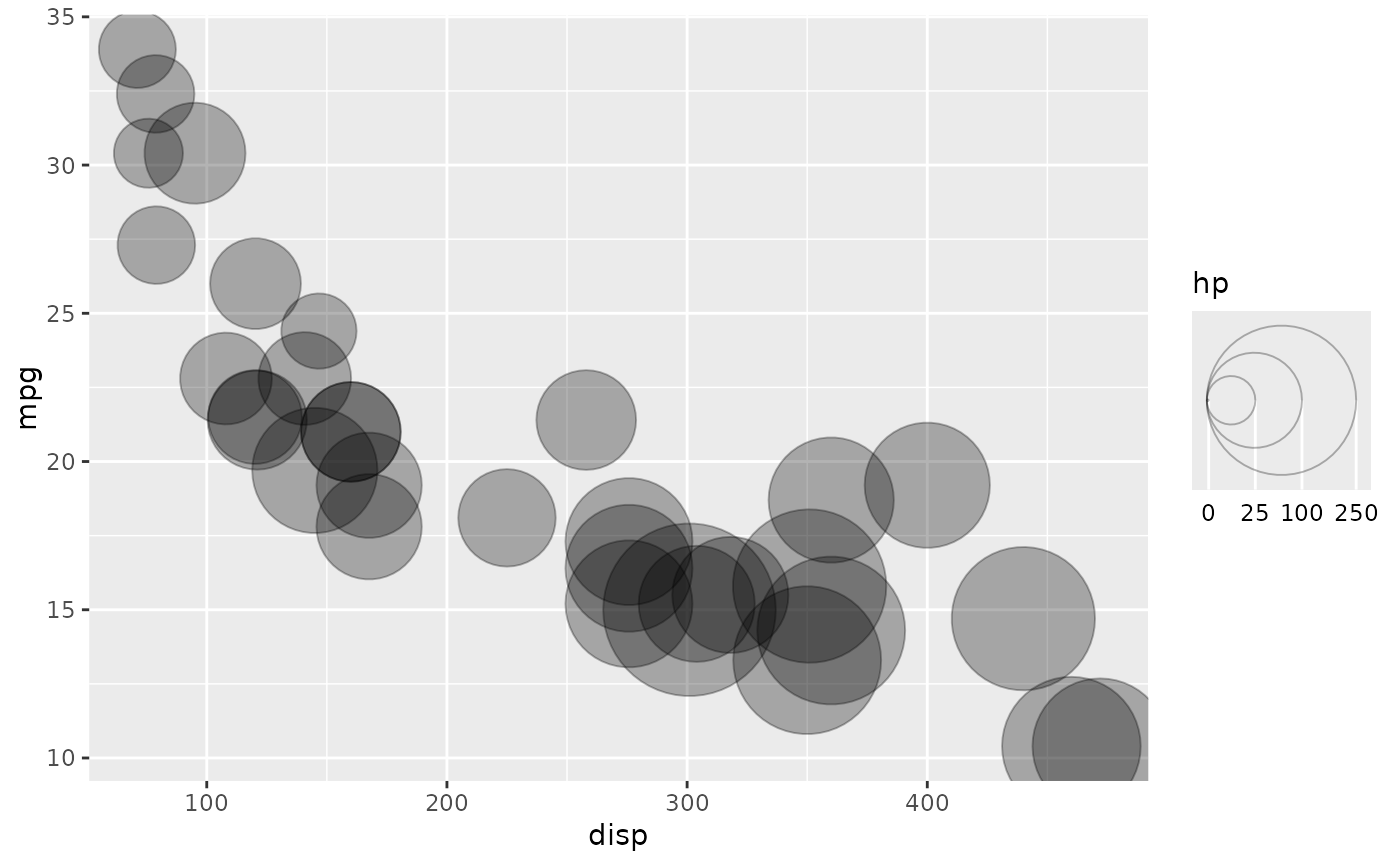
 # Horizontal orientation
p + guides(size = guide_circles(
vjust = 0.5, hjust = 0, text_position = "bottom"
))
# Horizontal orientation
p + guides(size = guide_circles(
vjust = 0.5, hjust = 0, text_position = "bottom"
))
 # Alternative text placement
p + guides(size = guide_circles(
text_position = "ontop",
clip_text = TRUE
))
# Alternative text placement
p + guides(size = guide_circles(
text_position = "ontop",
clip_text = TRUE
))
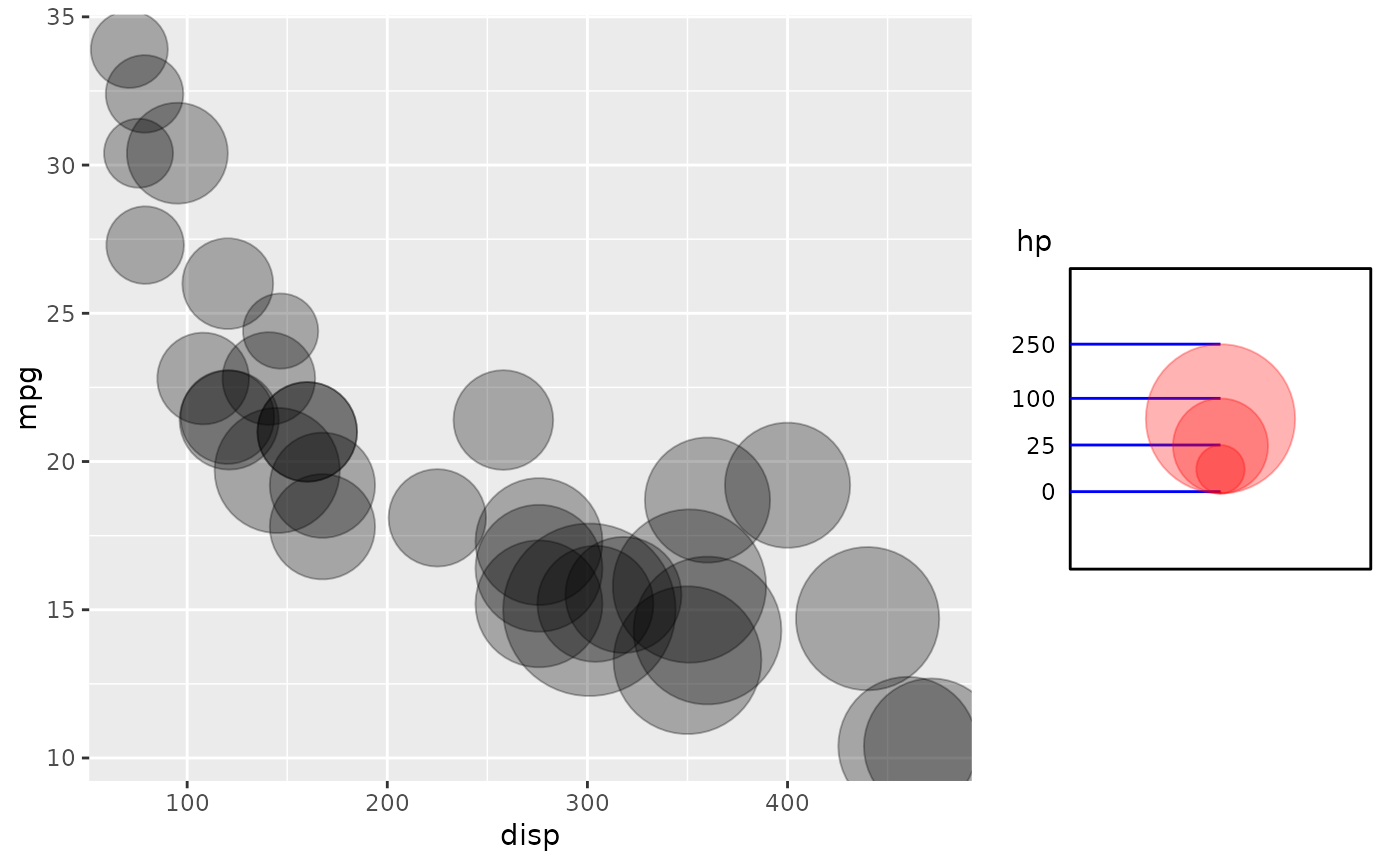
 # More styling options
p + guides(size = guide_circles(override.aes = aes(colour = "red")))+
theme(
# Key background
legend.key = element_rect(colour = "black", fill = 'white'),
# Padding around central shapes
legendry.legend.key.margin = margin(1, 1, 1, 1, "cm"),
legend.ticks = element_line(colour = "blue"),
legend.text.position = "left"
)
# More styling options
p + guides(size = guide_circles(override.aes = aes(colour = "red")))+
theme(
# Key background
legend.key = element_rect(colour = "black", fill = 'white'),
# Padding around central shapes
legendry.legend.key.margin = margin(1, 1, 1, 1, "cm"),
legend.ticks = element_line(colour = "blue"),
legend.text.position = "left"
)