This guide can place other guides on top of one another.
Arguments
- ...
Guides to stack in composition. Each guide can be specified as one of the following:
A
<Guide>class object.A
<function>that returns a<Guide>class object.A
<character[1]>naming such a function, without theguide_orprimitive_prefix.
- args
A
<list>of arguments to pass to guides that are given either as a function or as a string.- key
A standard key specification. The key is shared among all guides that have
NULLkeys themselves. See more information in the linked topic.- title
One of the following to indicate the title of the guide:
- angle
A specification for the text angle. Compared to setting the
angleargument inelement_text(), this argument uses some heuristics to automatically pick thehjustandvjustthat you probably want. Can be one of the following:NULLto take angles and justification settings directly from the theme.waiver()to allow reasonable defaults in special cases.A
<numeric[1]>between -360 and 360 for the text angle in degrees.
- theme
A
<theme>object to style the guide individually or differently from the plot's theme settings. Thethemeargument in the guide overrides and is combined with the plot's theme.- order
A positive
<integer[1]>that specifies the order of this guide among multiple guides. This controls in which order guides are merged if there are multiple guides for the same position. If0(default), the order is determined by a hashing indicative settings of a guide.- position
A
<character[1]>giving the location of the guide. Can be one of"top","bottom","left"or"right".- available_aes
A
<character>giving aesthetics that must match the the guides.
Details
Styling options
There are no styling options in theme() for this composition.
See also
Other composition:
compose_crux(),
compose_sandwich(),
compose_stack(),
guide-composition
Examples
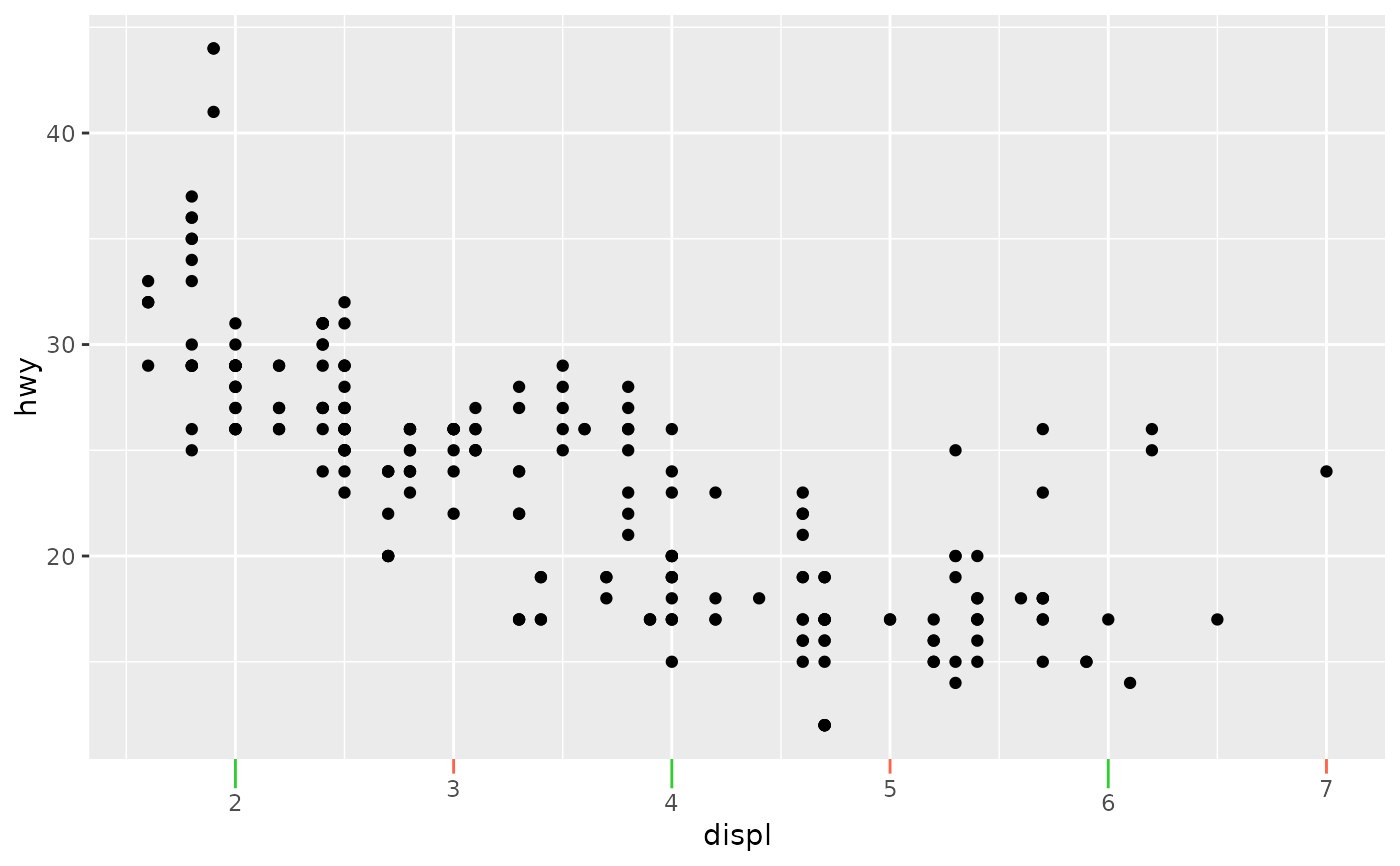
# Using the ontop composition to get two types of ticks with different
# lengths
ggplot(mpg, aes(displ, hwy)) +
  geom_point() +
  guides(x = compose_ontop(
    guide_axis_base(
      key_manual(c(2, 4, 6)),
      theme = theme(
        axis.ticks = element_line(colour = "limegreen"),
        axis.ticks.length = unit(11, "pt")
      )
    ),
    guide_axis_base(
      key_manual(c(3, 5, 7)),
      theme = theme(
        axis.ticks = element_line(colour = "tomato"),
        axis.ticks.length = unit(5.5, "pt")
      )
    )
  ))