Arguments
- key
A standard key specification. The key is shared among all guides that have
NULLkeys themselves. See more information in the linked topic.- centre, left, right, top, bottom
Guides to use in composition per position. Each guide can be specified as one of the following:
A
<Guide>class object.A
<function>that returns a<Guide>class object.A
<character>naming such a function, without theguide_orprimitive_prefix.
- args
A
<list>of arguments to pass to guides that are given either as a function or as a string.- complete
A
<logical[1]>whether to treat the composition as a complete guide. IfTRUE, a title and margin are added to the result. IfFALSE(default), no titles and margins are added.- theme
A
<theme>object to style the guide individually of differently from the plot's theme settings. Thethemearguments in the guide overrides, and is combined with, the plot's theme.- theme_defaults
A
<list>of theme elements to override undeclared theme arguments.- reverse
A
<logical[1]>whether to reverse continuous guides. IfTRUE, guides like colour bars are flipped. IfFALSE(default), the original order is maintained.- order
A positive
<integer[1]>that specifies the order of this guide among multiple guides. This controls in which order guides are merged if there are multiple guides for the same position. If0(default), the order is determined by a hashing indicative settings of a guide.- title
One of the following to indicate the title of the guide:
- position
Where this guide should be drawn: one of
"top","bottom","left", or"right".- available_aes
A
<character>vector listing the aesthetics for which this guide can be build.
See also
Other composition:
compose_ontop(),
compose_sandwich(),
compose_stack(),
guide-composition
Examples
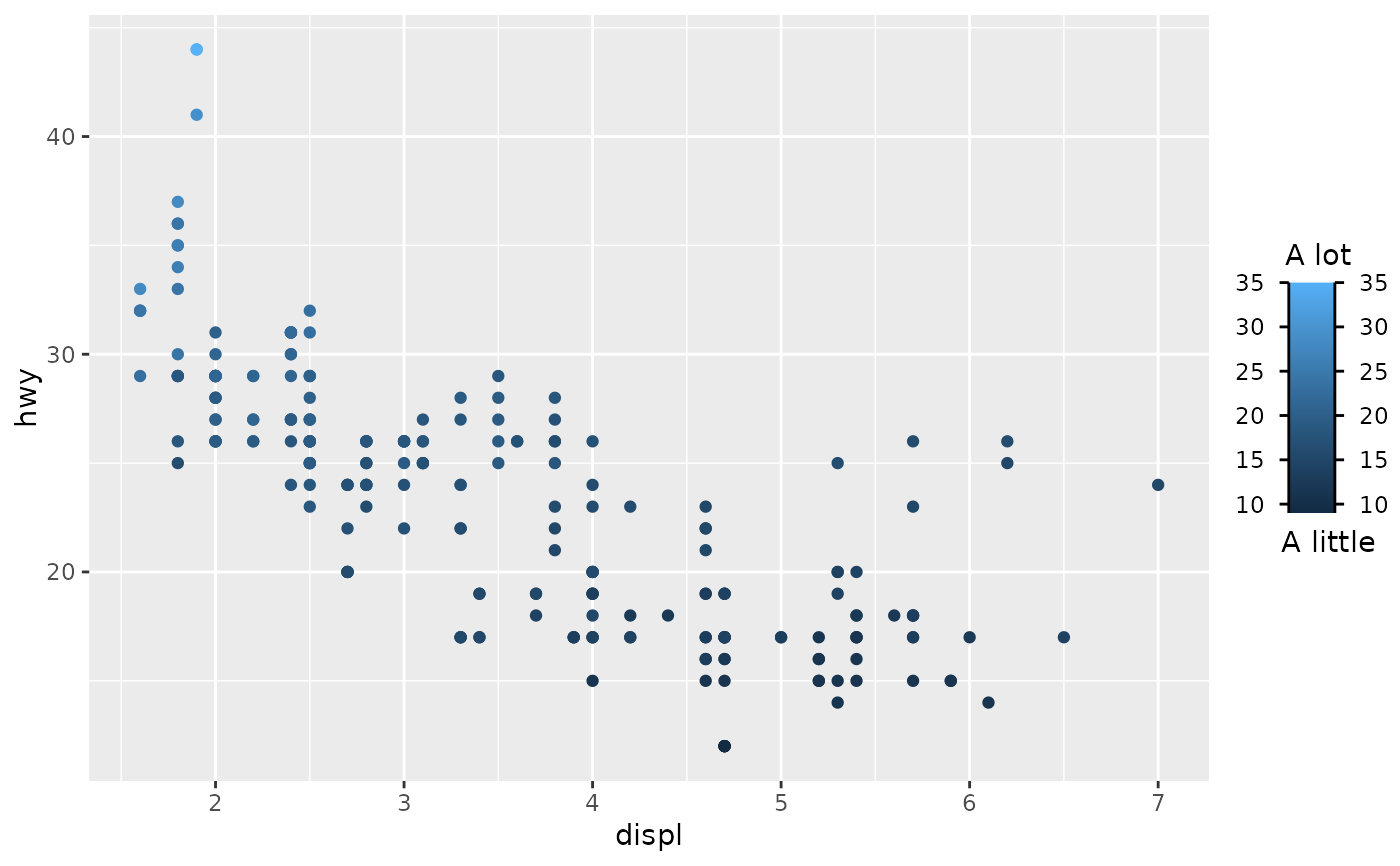
# Roughly recreating a colour bar with extra text on top and bottom
crux <- compose_crux(
  centre = gizmo_barcap(), left = "axis_base",
  right = "axis_base",
  top = primitive_title("A lot"),
  bottom = primitive_title("A little")
)

ggplot(mpg, aes(displ, hwy)) +
  geom_point(aes(colour = cty)) +
  guides(colour = crux)

