This guide displays a colour bar with optional caps at either ends of the bar.
Usage
gizmo_barcap(
  key = "sequence",
  shape = "triangle",
  size = NULL,
  show = NA,
  alpha = NA,
  oob = "keep",
  theme = NULL,
  position = waiver(),
  direction = NULL
)
Arguments
- key
A sequence key specification. Defaults to
key_sequence(n = 15). Changing the argument tokey_sequence()is fine, but changing the key type is not advised.- shape
A cap specification by providing one of the following:
A cap
<function>, such ascap_triangle().A
<character[1]>naming a cap function without the 'cap_'-prefix, e.g."round".A two column
<matrix[n, 2]>giving coordinates for a cap, like those created by cap functions such ascap_arch().
- size
A
<unit>setting the size of the cap. WhenNULL(default), cap size will be proportional to theshapecoordinates and thelegend.key.sizetheme setting.- show
A
<logical>to control how caps are displayed at the ends of the bar. WhenTRUE, caps are always displayed. WhenFALSE, caps are never displayed. WhenNA(default), caps are displayed when the data range exceed the limits. When given as<logical[2]>,show[1]controls the display at the lower end andshow[2]at the upper end.- alpha
A
<numeric[1]>between 0 and 1 setting the colour transparency of the bar. UseNAto preserve the alpha encoded in the colour itself.- oob
An out-of-bounds handling function that affects the cap colour. Can be one of the following:
A
<function>likeoob_squish.A
<character[1]>naming such a function without the 'oob'-prefix, such as"keep".
- theme
A
<theme>object to style the guide individually or differently from the plot's theme settings. Thethemeargument in the guide overrides and is combined with the plot's theme.- position
A
<character[1]>giving the location of the guide. Can be one of"top","bottom","left"or"right".- direction
A
<character[1]>indicating the direction of the guide. Can be on of"horizontal"or"vertical".
Details
Styling options
Below are the theme options that determine the styling of
this guide. Note that the width or height (depending on the direction
argument) includes the cap.
| Theme setting | Type | Description |
legend.frame | element_rect() | Frame drawn around the bar and caps. The fill setting is ignored. |
legend.key.width | unit() | Width of the bar |
legend.key.height | unit() | Height of the bar |
Please note that depending on the direction argument, the
legend.key.width/legend.key.height setting are expanded 5-fold if
originating from the global theme. To set these directly, you can use the
local theme argument in the guide.
These settings have shorthands in theme_guide():
gizmo_barcap(theme = theme_guide(
  frame = element_rect(),
  key.width = unit(5, "mm")
  key.height = unit(5, "cm")
))
See also
Other gizmos:
gizmo_density(),
gizmo_grob(),
gizmo_histogram(),
gizmo_stepcap()
Examples
# A standard plot
p <- ggplot(mpg, aes(displ, hwy, colour = cty)) +
geom_point()
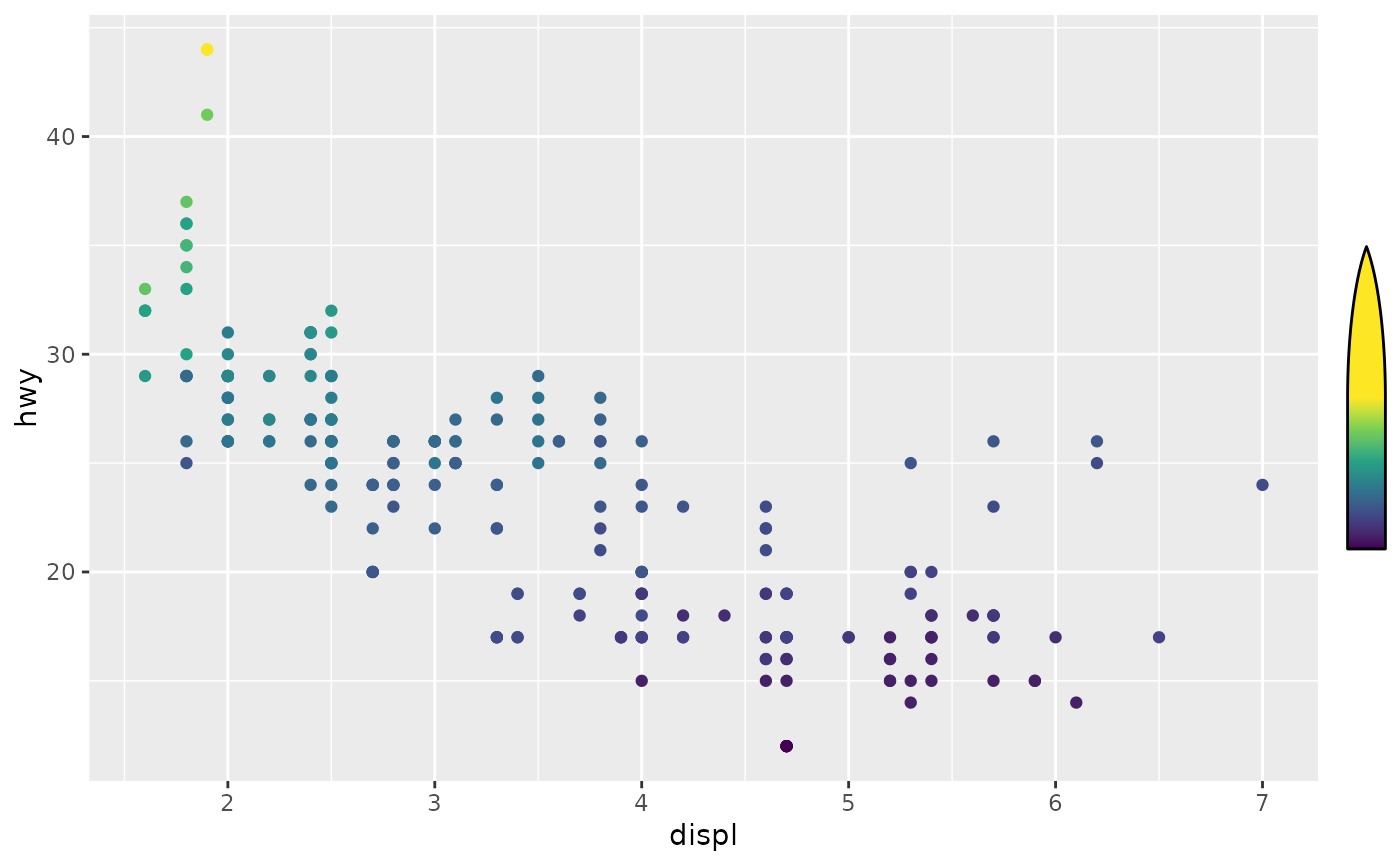
# Just a bar
p + scale_colour_viridis_c(guide = gizmo_barcap())
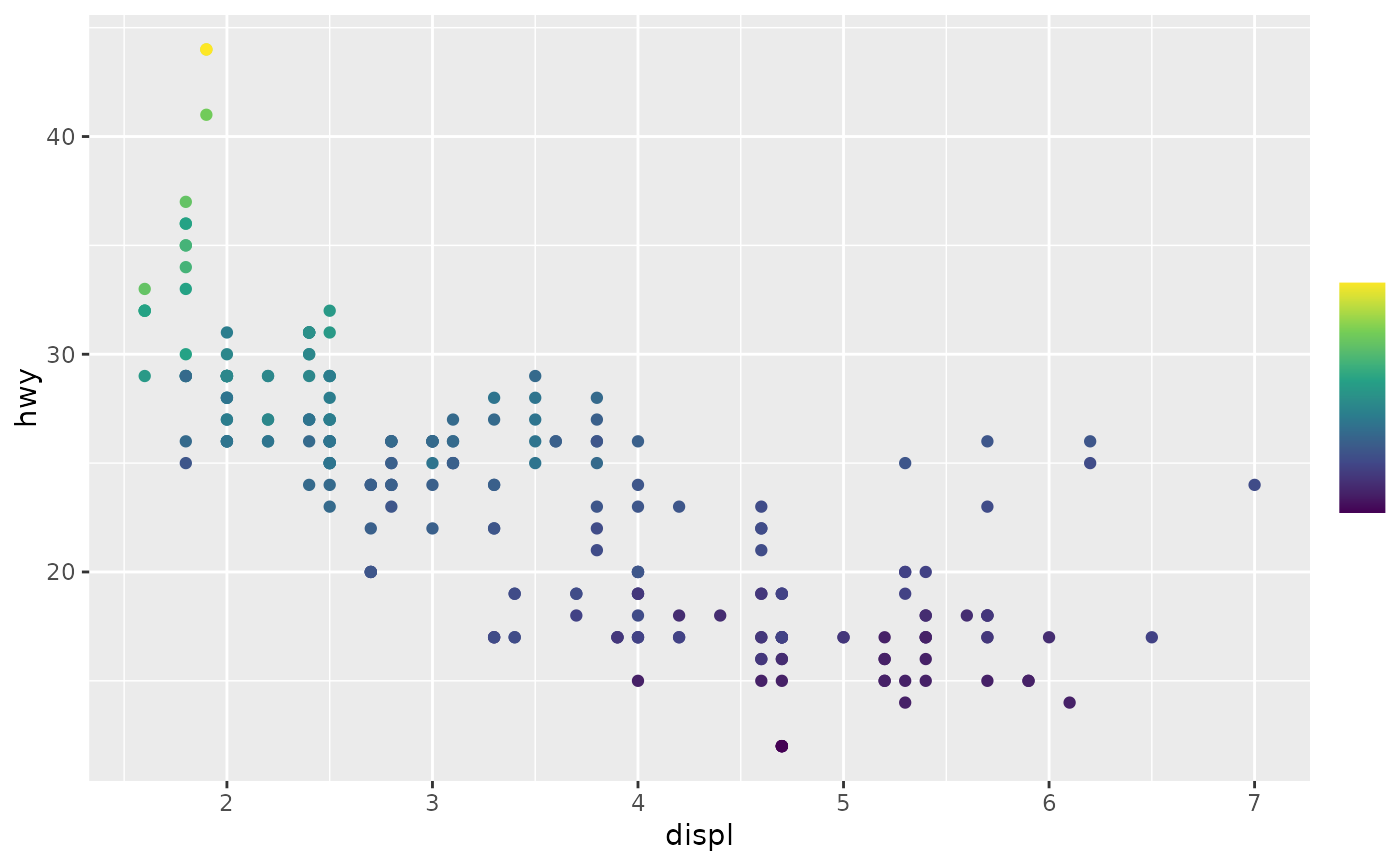 # Caps show up when there is data outside the limits
p + scale_colour_viridis_c(
limits = c(10, 30),
guide = gizmo_barcap()
)
# Caps show up when there is data outside the limits
p + scale_colour_viridis_c(
limits = c(10, 30),
guide = gizmo_barcap()
)
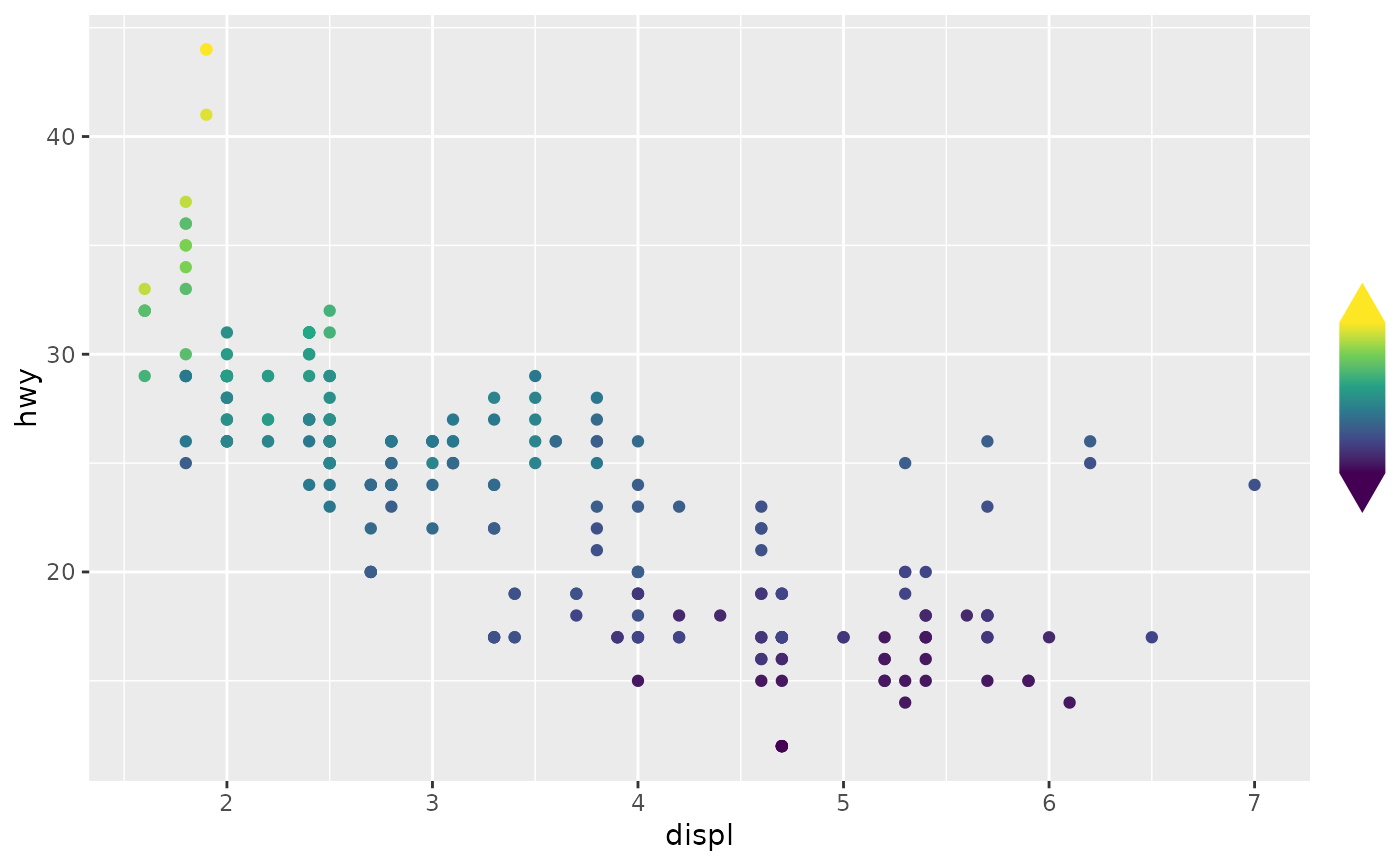
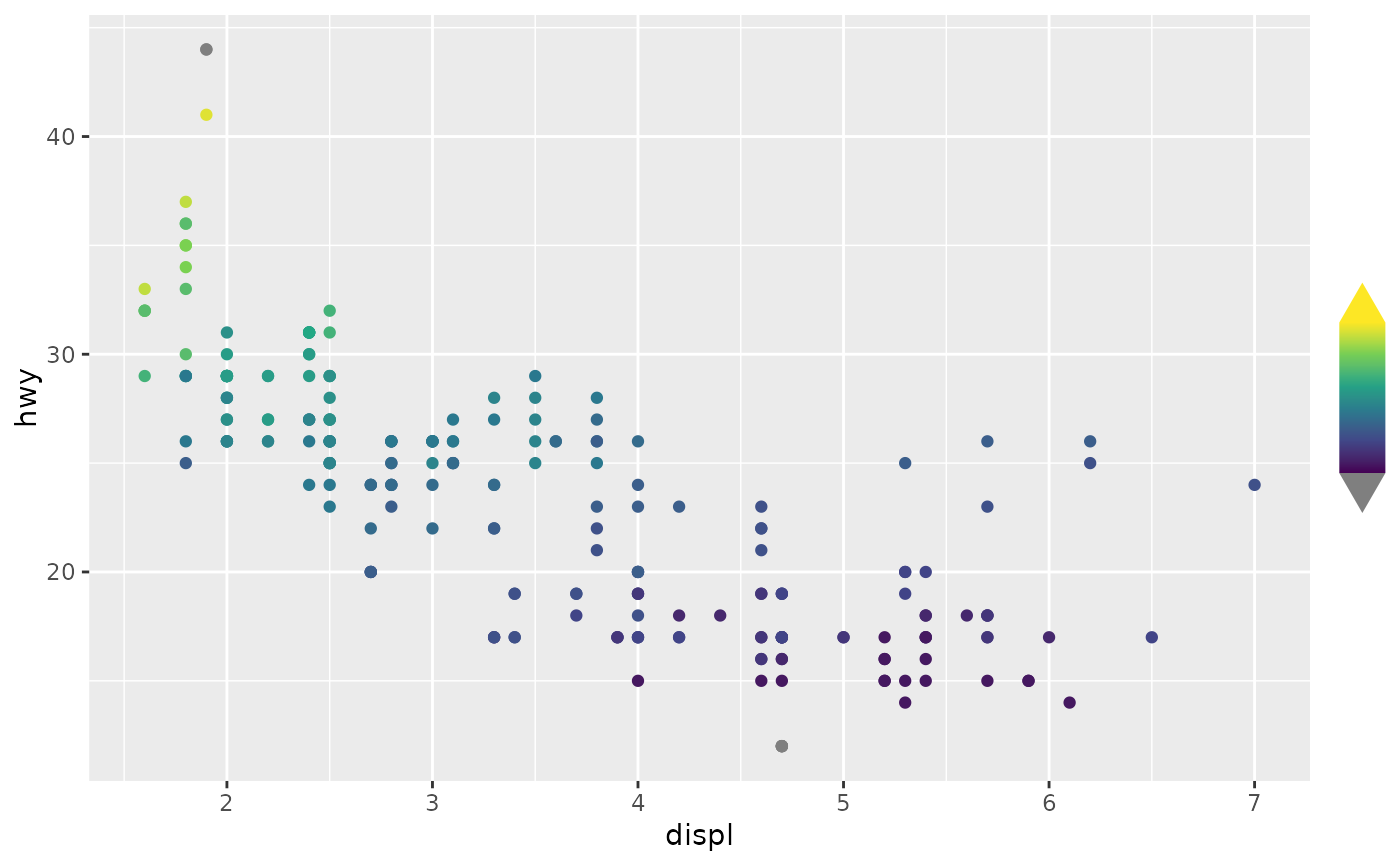 # The scale's out-of-bounds handler determines cap colour
p + scale_colour_viridis_c(
limits = c(10, 30), oob = scales::oob_squish,
guide = gizmo_barcap()
)
# The scale's out-of-bounds handler determines cap colour
p + scale_colour_viridis_c(
limits = c(10, 30), oob = scales::oob_squish,
guide = gizmo_barcap()
)
 # Customising display of the guide
p +
scale_colour_viridis_c(
oob = scales::oob_squish,
guide = gizmo_barcap(
shape = "arch", show = c(FALSE, TRUE),
size = unit(2, "cm"),
theme = theme(legend.key.height = unit(4, "cm"))
)
) +
theme(
legend.frame = element_rect(colour = "black"),
legend.key.width = unit(0.5, "cm")
)
# Customising display of the guide
p +
scale_colour_viridis_c(
oob = scales::oob_squish,
guide = gizmo_barcap(
shape = "arch", show = c(FALSE, TRUE),
size = unit(2, "cm"),
theme = theme(legend.key.height = unit(4, "cm"))
)
) +
theme(
legend.frame = element_rect(colour = "black"),
legend.key.width = unit(0.5, "cm")
)