This guide displays a histogram of the aesthetic. If the aesthetic is
colour or fill, the shape will reflect this.
Arguments
- key
A sequence key or binned key specification. Internally defaults to a sequence key when the scale is continuous and a binned key when the scale is binned.
- hist
One of the following:
NULLfor computing histograms on the data values (default).an atomic
<vector>to feed to thehist.funfunction.A named
<list>withbreaksandcountsnumeric items, where thebreaksitem is exactly one element longer than thecountsitem. A typical way to construct such list is using thehist()function. Please note that<list>input is expected in scale-transformed space, not original data space.
- hist.args
A
<list>with additional arguments to thehist.funargument. Only applies whenhistis not provided as a<list>already. Please note that these arguments are only used for binning and counting: graphical arguments are ignored.- hist.fun
A
<function>to use for computing histograms when thehistargument is not provided as a list already.- just
A
<numeric[1]>between 0 and 1. Use 0 for bottom- or left-aligned histograms, use 1 for top- or right-aligned histograms and 0.5 for centred histograms.- oob
An out-of-bounds handling function that affects the cap colour. Can be one of the following:
A
<function>likeoob_squish.A
<character[1]>naming such a function without the 'oob'-prefix, such as"keep".
- metric
A
<character[1]>either"counts"or"density"stating which field of the<histogram>class to display. The"density"metric might be more appropriate to display when the histogram breaks have non-constant intervals.- alpha
A
<numeric[1]>between 0 and 1 setting the colour transparency of the bar. UseNAto preserve the alpha encoded in the colour itself.- theme
A
<theme>object to style the guide individually or differently from the plot's theme settings. Thethemeargument in the guide overrides and is combined with the plot's theme.- position
A
<character[1]>giving the location of the guide. Can be one of"top","bottom","left"or"right".- direction
A
<character[1]>indicating the direction of the guide. Can be on of"horizontal"or"vertical".
Details
Non-finite values such as NA and NaN are ignored while infinite values
such as -Inf and Inf are squished to the limits.
Styling options
Below are the theme options that determine the styling of this guide.
| Theme setting | Type | Description |
legend.frame | element_rect() | Outline drawn around the histogram itself. The fill setting is ignored. |
legend.key | element_rect() | Background underneath the histogram area. |
legend.key.width | unit() | Width of the histogram area. |
legend.key.height | unit() | Height of the histogram area. |
Please note that depending on the direction argument, the
legend.key.width/legend.key.height setting are expanded 5-fold if
originating from the global theme. To set these directly, you can use the
local theme argument in the guide.
These settings have shorthands in theme_guide():
gizmo_histogram(theme = theme_guide(
  frame = element_rect(),
  key = element_rect(),
  key.width = unit(5, "mm")
  key.height = unit(5, "cm")
))
See also
Other gizmos:
gizmo_barcap(),
gizmo_density(),
gizmo_grob(),
gizmo_stepcap()
Examples
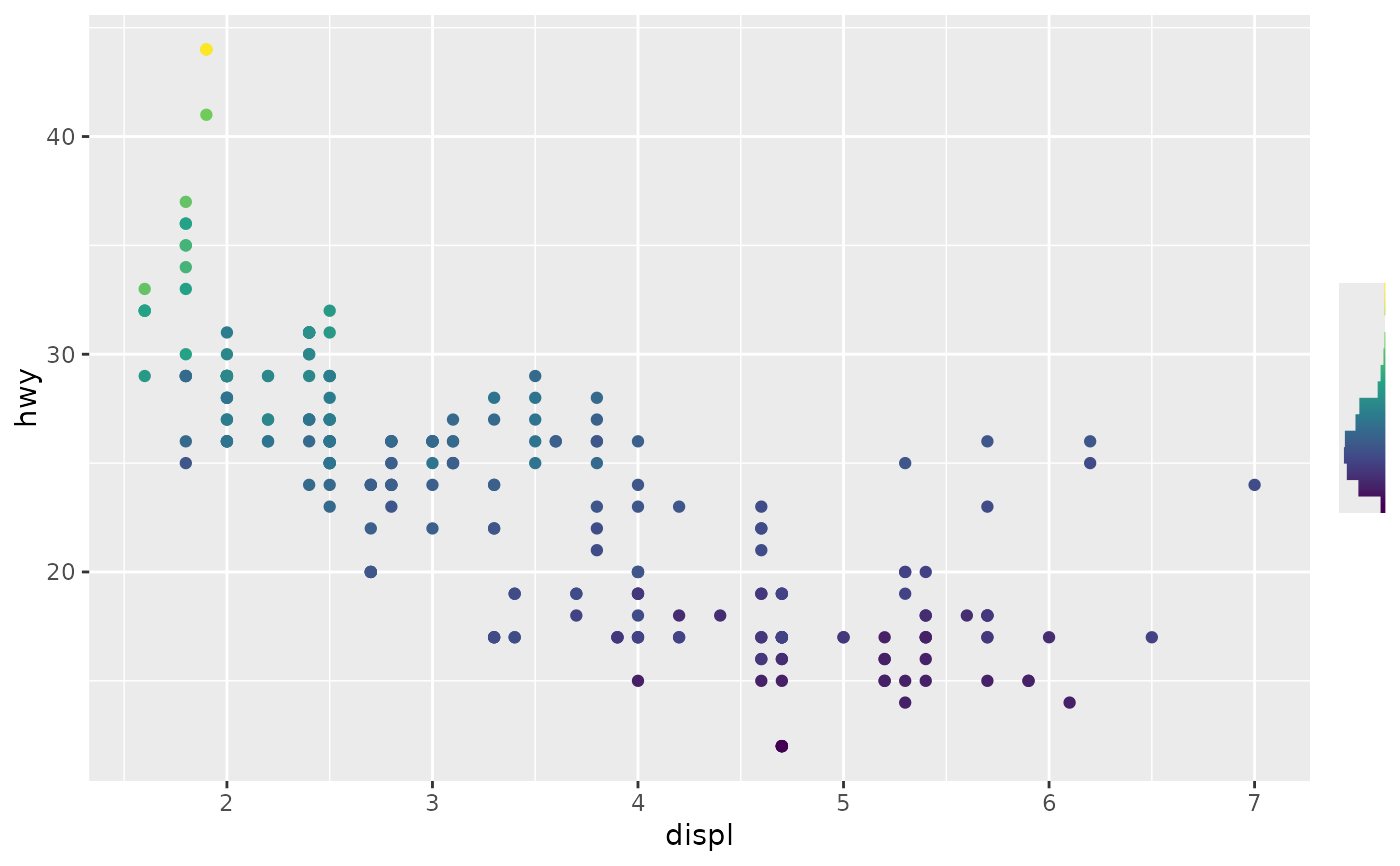
# A standard plot
p <- ggplot(mpg, aes(displ, hwy, colour = cty)) +
geom_point() +
scale_colour_viridis_c()
# Histogram from plot data
p + guides(colour = gizmo_histogram())
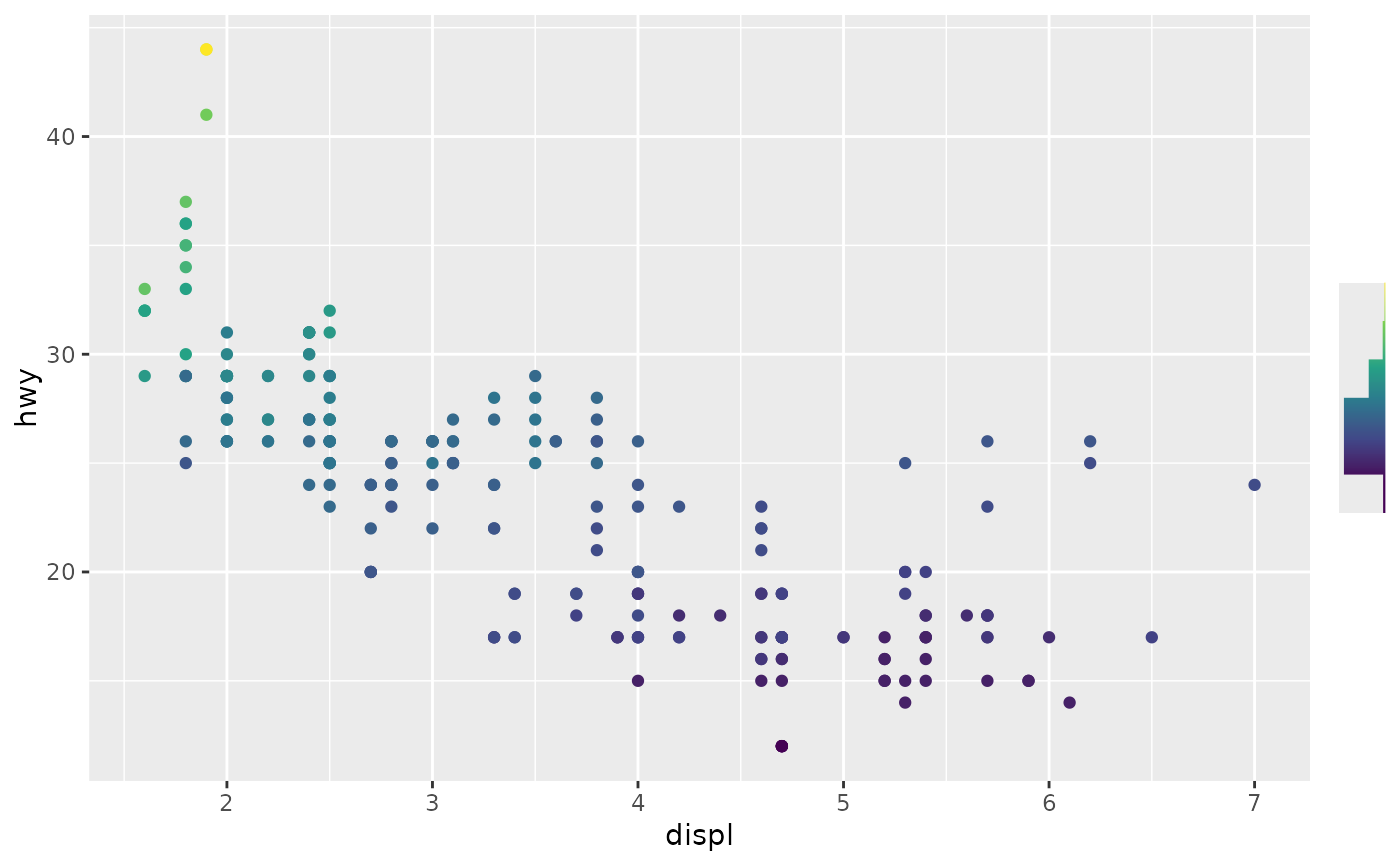 # Using bins instead of gradient
p + guides(colour = gizmo_histogram("bins"))
# Using bins instead of gradient
p + guides(colour = gizmo_histogram("bins"))
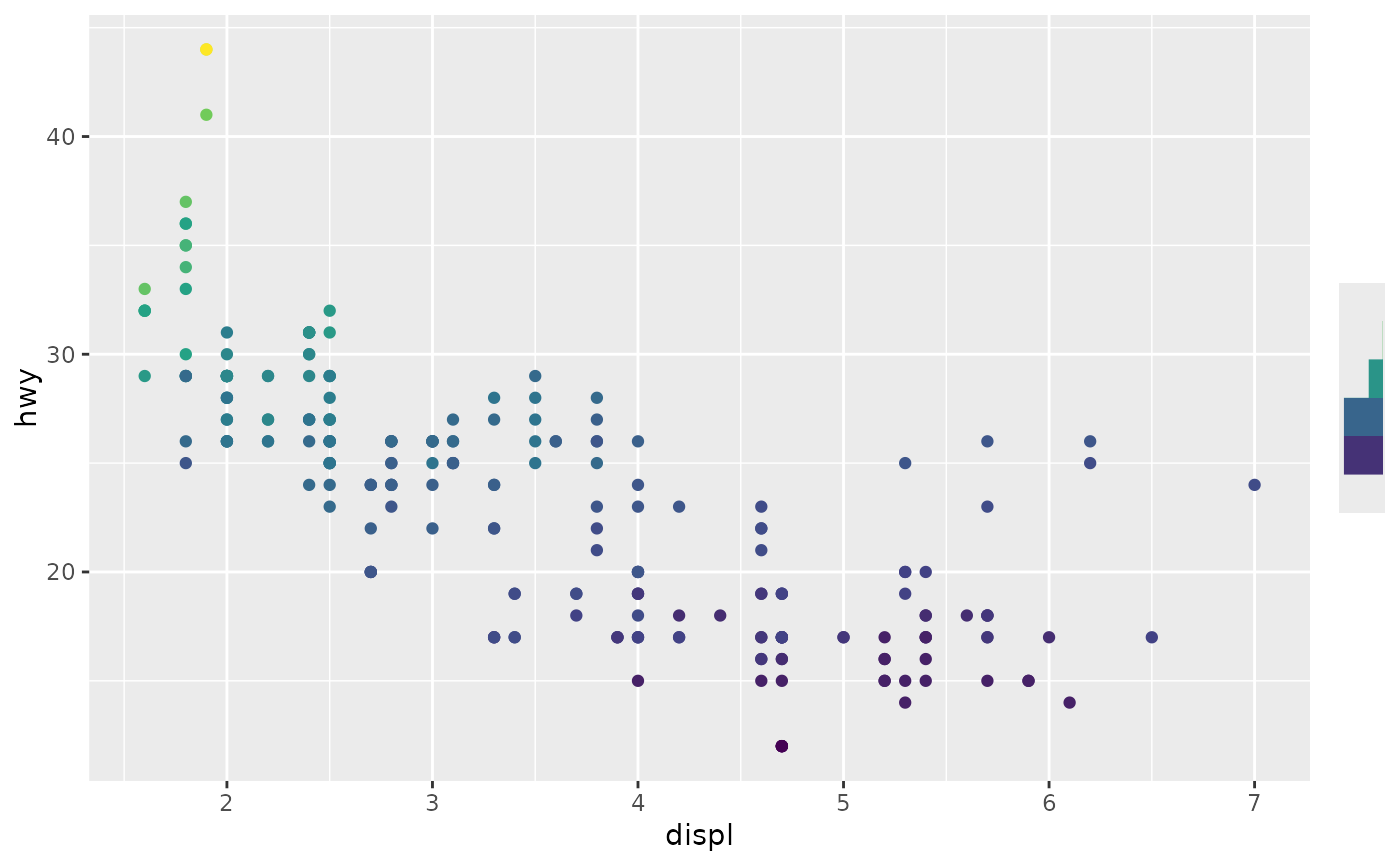 # Providing custom values to compute histogram
p + guides(colour = gizmo_histogram(hist = runif(1000, min = 5, max = 35)))
# Providing custom values to compute histogram
p + guides(colour = gizmo_histogram(hist = runif(1000, min = 5, max = 35)))
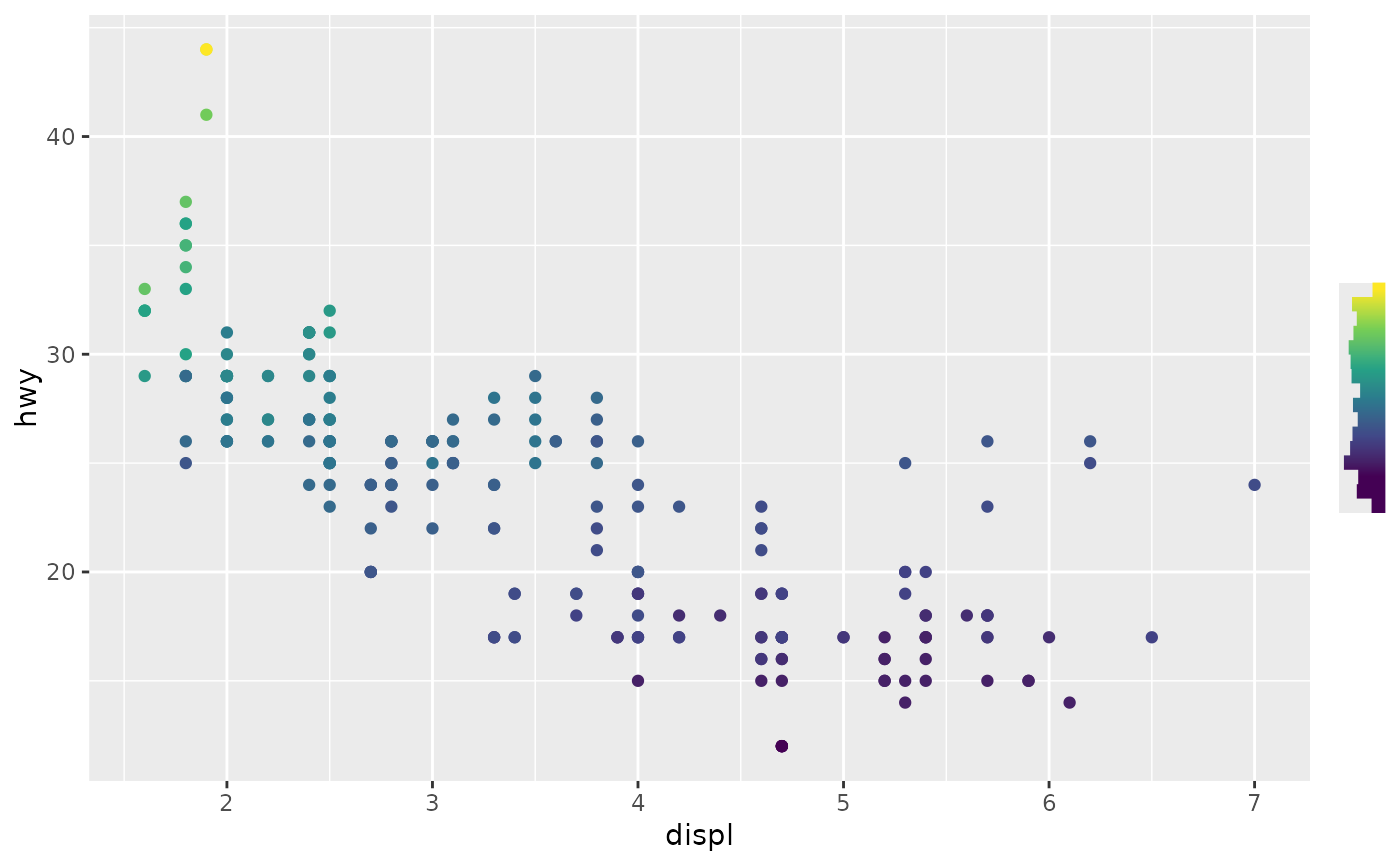 # Providing precomputed histogram
p + guides(colour = gizmo_histogram(hist = hist(mpg$cty, breaks = 10)))
# Providing precomputed histogram
p + guides(colour = gizmo_histogram(hist = hist(mpg$cty, breaks = 10)))
 # Alternatively, parameters may be passed through hist.args
p + guides(colour = gizmo_histogram(hist.arg = list(breaks = 10)))
# Alternatively, parameters may be passed through hist.args
p + guides(colour = gizmo_histogram(hist.arg = list(breaks = 10)))