This function does three things different than theme().
Usage
theme_guide(
  text = NULL,
  line = NULL,
  title = NULL,
  subtitle = NULL,
  text.position = NULL,
  title.position = NULL,
  subtitle.position = NULL,
  ticks = NULL,
  minor.ticks = NULL,
  mini.ticks = NULL,
  ticks.length = NULL,
  minor.ticks.length = NULL,
  mini.ticks.length = NULL,
  spacing = NULL,
  group.spacing = NULL,
  table.spacing = NULL,
  key = NULL,
  key.size = NULL,
  key.width = NULL,
  key.height = NULL,
  key.spacing = NULL,
  key.spacing.x = NULL,
  key.spacing.y = NULL,
  key.margin = NULL,
  key.justification = NULL,
  frame = NULL,
  byrow = NULL,
  background = NULL,
  margin = NULL,
  bracket = NULL,
  bracket.size = NULL,
  box = NULL,
  fence = NULL,
  fence.post = NULL,
  fence.rail = NULL,
  zebra.light = NULL,
  zebra.dark = NULL,
  point = NULL,
  connector = NULL
)
Arguments
- text
An
<element_text>setting bothlegend.textandaxis.textelements.- line
An
<element_line>setting bothlegend.axis.lineandaxis.lineelements.- title
An
<element_text>setting bothlegend.titleandaxis.titleelements.- subtitle
An
<element_text>setting bothlegendry.legend.subtitleandlegendry.axis.subtitleelements.- text.position, title.position, subtitle.position
One of
"top","right","bottom"or"right"setting the following elements:text.position: sets onlylegend.text.position.title.position: sets onlylegend.title.position.subtitle.positionsets bothlegendry.legend.subtitle.positionandlegendry.axis.subtitle.position
- ticks
An
<element_line>setting bothaxis.ticksandlegend.tickselements.- minor.ticks
An
<element_line>settinglegendry.legend.minor.ticksand all 6 of theaxis.ticks.minor.{r/theta/x.top/x.bottom/y.left/y.right}elements.- mini.ticks
An
<element_line>setting bothlegendry.legend.mini.ticksandlegendry.axis.mini.tickselements.- ticks.length, minor.ticks.length, mini.ticks.length
A [
<unit[1]>][grid::unit()] setting the following elements:ticks.length: sets bothlegend.ticks.lengthandaxis.ticks.length.minor.ticks.lengthsets bothaxis.minor.ticks.lengthandlegendry.legend.minor.ticks.length.mini.ticks.lengthsets bothlegendry.axis.mini.ticks.lengthandlegendry.legend.mini.ticks.length.
- spacing, group.spacing, table.spacing
A [
<unit[1]>][grid::unit()] settingthelegendry.guide.spacing,legendry.group.spacingandlegendry.table.spacingtheme elements respectively.- key
An
<element_rect>setting thelegend.keyelement.- key.size, key.width, key.height
A
<unit>setting thelegend.key.size,legend.key.widthandlegend.key.heightelements respectively.- key.spacing, key.spacing.x, key.spacing.y
A [
<unit[1]>][grid::unit()] setting thelegend.key.spacing,legend.key.spacing.xandlegend.key.spacing.yelements respectively.- key.margin
A
<margin>setting the margin around legend glyphs.- key.justification
A [
<numeric[2]>] passed to thelegend.key.justificationsetting.- frame
An
<element_rect>setting thelegend.frameelement.- byrow
A
<logical[1]>setting thelegend.byrowelement.- background
An
<element_rect>setting thelegend.backgroundelement.- margin
A
<margin>setting thelegend.marginelement.- bracket
An
<element_line>setting thelegendry.bracketelement.- bracket.size
A [
<unit[1]>][grid::unit()] setting thelegendry.bracket.sizeelement.- box
An
<element_rect>setting thelegendry.boxelement.- fence, fence.post, fence.rail
An
<element_line>setting thelegendry.fence,legendry.fence.postandlegendry.fence.railrespectively.- zebra.light, zebra.dark
An
<element_rect>setting thelegendry.zebra.lightandlegendry.zebra.darksettings respectively.- point
An
<element_point>setting thelegendry.pointelement.- connector
An
<elemenet_line>setting thelegendry.connectorelement.
Details
It has shorthand names for various guide settings, similar to
theme_sub_legend()andtheme_sub_axis()It simultaneously sets theme elements for axes and legends. This makes it contextually agnostic. For example, setting
theme_guide(text)will populatelegend.textand alsoaxis.text.It includes legendry specific settings.
The first two things make it very good for setting the guide_*(theme)
arguments. The second thing makes it very bad for setting plot-wide or
global themes.
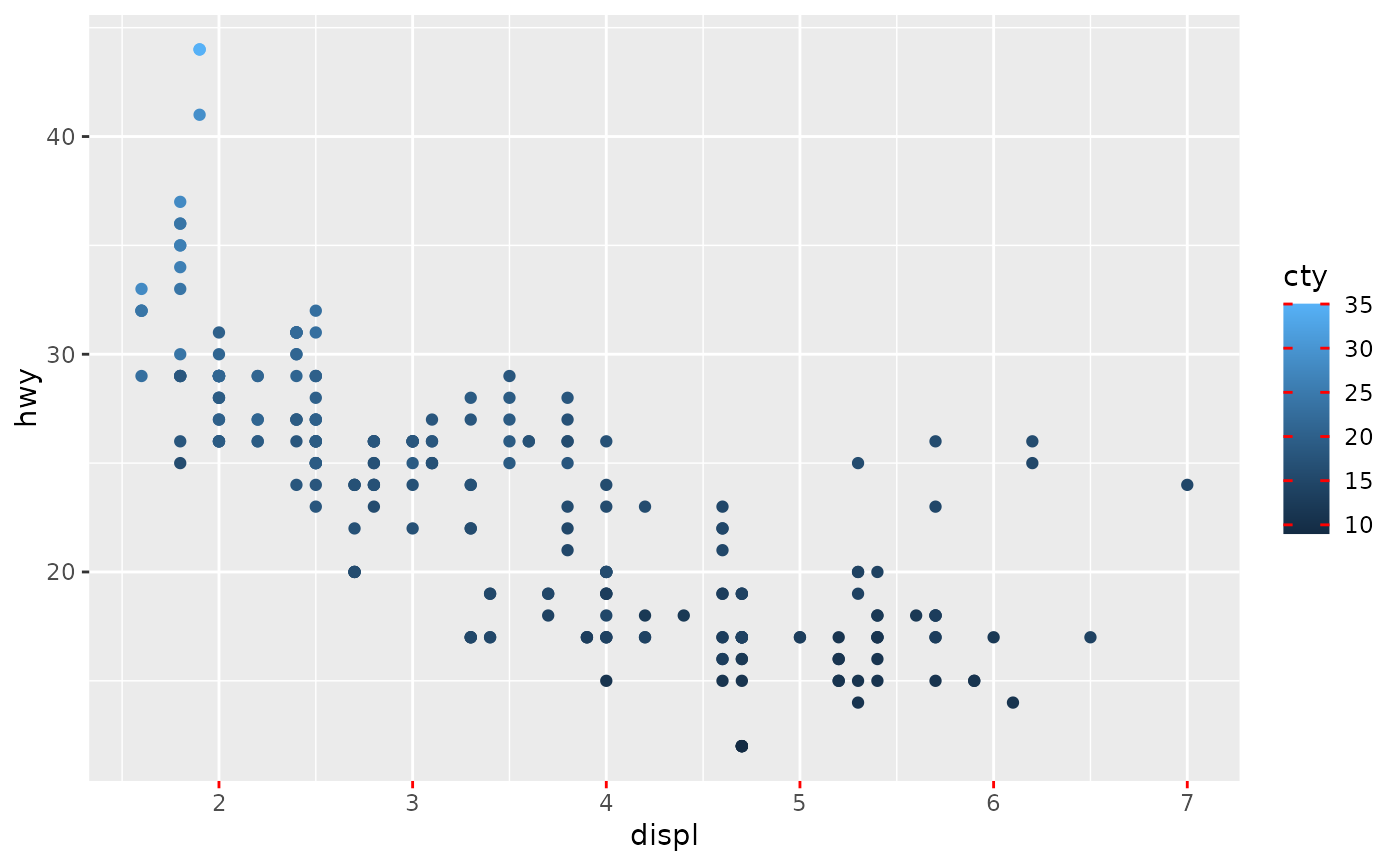
Examples
red_ticks <- theme_guide(
  ticks = element_line(colour = "red", linewidth = 0.5)
)

# Both axis and colourbar gain red ticks
ggplot(mpg, aes(displ, hwy, colour = cty)) +
  geom_point() +
  guides(
    colour = guide_colourbar(theme = red_ticks),
    x = guide_axis(theme = red_ticks)
  )