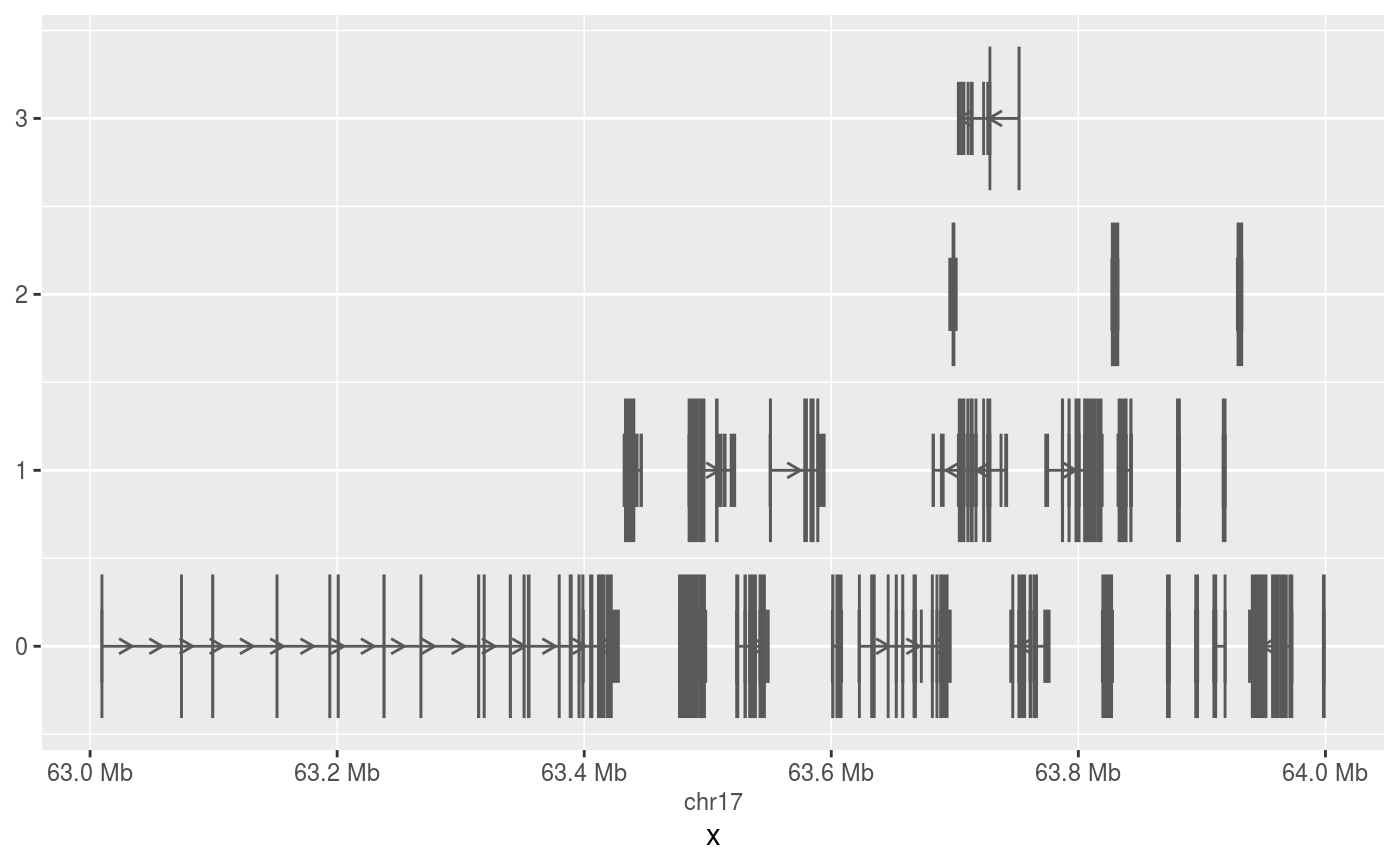
geom_genemodel is a specialised geom for drawing gene
models. It draws coding sequences thicker than untranslated regions and
styles introns with arrows, lines or chevrons. By default, it separates
different overlapping models along the y-axis.
geom_genemodel(
  mapping = NULL,
  data = NULL,
  stat = "identity",
  position = position_disjoint_ranges(extend = 10000),
  ...,
  intron.style = "arrowline",
  arrow = NULL,
  arrow.freq = unit(4, "mm"),
  chevron.height = 1,
  linejoin = "mitre",
  na.rm = FALSE,
  show.legend = NA,
  inherit.aes = TRUE
)
Arguments
| mapping | Set of aesthetic mappings created by |
|---|---|
| data | The data to be displayed in this layer. There are three options: If A A |
| stat | The statistical transformation to use on the data for this layer, as a string. |
| position | Position adjustment, either as a string, or the result of a call to a position adjustment function. |
| ... | Other arguments passed on to |
| intron.style | By default, introns are displayed as a series of arrows
( |
| arrow | Specification for arrow heads, as created by
|
| arrow.freq | A |
| chevron.height | A |
| linejoin | Line join style (round, mitre, bevel). |
| na.rm | If |
| show.legend | logical. Should this layer be included in the legends?
|
| inherit.aes | If |
Details
The expected input format is that every exon has its own row. The
genomic location of the exons are to be given to the xmin aesthetic
for start positions and the xmax aesthetic for the end position.
Genes are interpreted to be groups of exons specified by the required
group aesthetic. Exons that belong to the same group will be
connected by introns.
Optionally, a distinction between coding sequences (CDSs) and untranslated
regions (UTRs) can be made for each exon by providing the exontype
aesthetic. Also, strand information can be used to style introns in the
"arrowline" or "chevron" fashion by providing a strand
aesthetic, which assumes that "+" should be oriented left-to-right
and "-" should be right-to-left. A y aesthetic can be
provided to offset the gene models from the x-axis. The thickness
aesthetic controls how thick a CDS should be drawn in y-axis units.
Alternatively, this geom can also be used to visualise transcript models,
in which case the following recommendations apply. Supply a transcript name
or transcript ID to the group aesthetic instead of a gene name or gene ID.
Set intron.style = "chevron" which is more appropriate for splice
junctions.
Aesthetics
geom_genemodel understands the following aesthetics (required
aesthetics are in bold, optional aesthetics in italics)
xmax
xmin
group
y
thickness
type
strand
colour
fill
size
linetype
alpha
See also
Examples
# Using GRanges for exons
require(GenomicRanges)
gm <- example_genemodels()
df <- DataFrame(x = granges(gm), mcols(gm))

ggplot(df) +
    geom_genemodel(aes(x = x, group = name, exontype = type))
