![[Deprecated]](figures/lifecycle-deprecated.svg) When discrete data has some inherent hierarchy to the relationship between
discrete categories, you can display a dendrogram instead of a tick axis.
These functions have been deprecated in favour of
When discrete data has some inherent hierarchy to the relationship between
discrete categories, you can display a dendrogram instead of a tick axis.
These functions have been deprecated in favour of
legendry::scale_{x/y}_dendro().
Arguments
- ...
Arguments passed on to
ggplot2::discrete_scaleaestheticsThe names of the aesthetics that this scale works with.
scale_name- The name of the scale
that should be used for error messages associated with this scale.
paletteA palette function that when called with a single integer argument (the number of levels in the scale) returns the values that they should take (e.g.,
scales::pal_hue()).nameThe name of the scale. Used as the axis or legend title. If
waiver(), the default, the name of the scale is taken from the first mapping used for that aesthetic. IfNULL, the legend title will be omitted.labelsOne of:
NULLfor no labelswaiver()for the default labels computed by the transformation objectA character vector giving labels (must be same length as
breaks)An expression vector (must be the same length as breaks). See ?plotmath for details.
A function that takes the breaks as input and returns labels as output. Also accepts rlang lambda function notation.
limitsOne of:
NULLto use the default scale valuesA character vector that defines possible values of the scale and their order
A function that accepts the existing (automatic) values and returns new ones. Also accepts rlang lambda function notation.
na.translateUnlike continuous scales, discrete scales can easily show missing values, and do so by default. If you want to remove missing values from a discrete scale, specify
na.translate = FALSE.na.valueIf
na.translate = TRUE, what aesthetic value should the missing values be displayed as? Does not apply to position scales whereNAis always placed at the far right.dropShould unused factor levels be omitted from the scale? The default,
TRUE, uses the levels that appear in the data;FALSEincludes the levels in the factor. Please note that to display every level in a legend, the layer should useshow.legend = TRUE.callThe
callused to construct the scale for reporting messages.superThe super class to use for the constructed scale
- hclust
An object of the type produced by the
stats::hclust()function.- expand
For position scales, a vector of range expansion constants used to add some padding around the data to ensure that they are placed some distance away from the axes. Use the convenience function
expansion()to generate the values for theexpandargument. The defaults are to expand the scale by 5% on each side for continuous variables, and by 0.6 units on each side for discrete variables.- guide
A function used to create a guide or its name. See
guides()for more information.- position
For position scales, The position of the axis.
leftorrightfor y axes,toporbottomfor x axes.
Details
The dendrogram type of scale does two things, first it reorders the
values along the relevant direction such that they follow the order
captured in the hclust argument. Secondly, it draws the dendrogram
at the axis. The dendrogram visuals inherit from the ticks theme elements,
so defining a linetype for the tick marks sets the linetype for the
dendrogram.
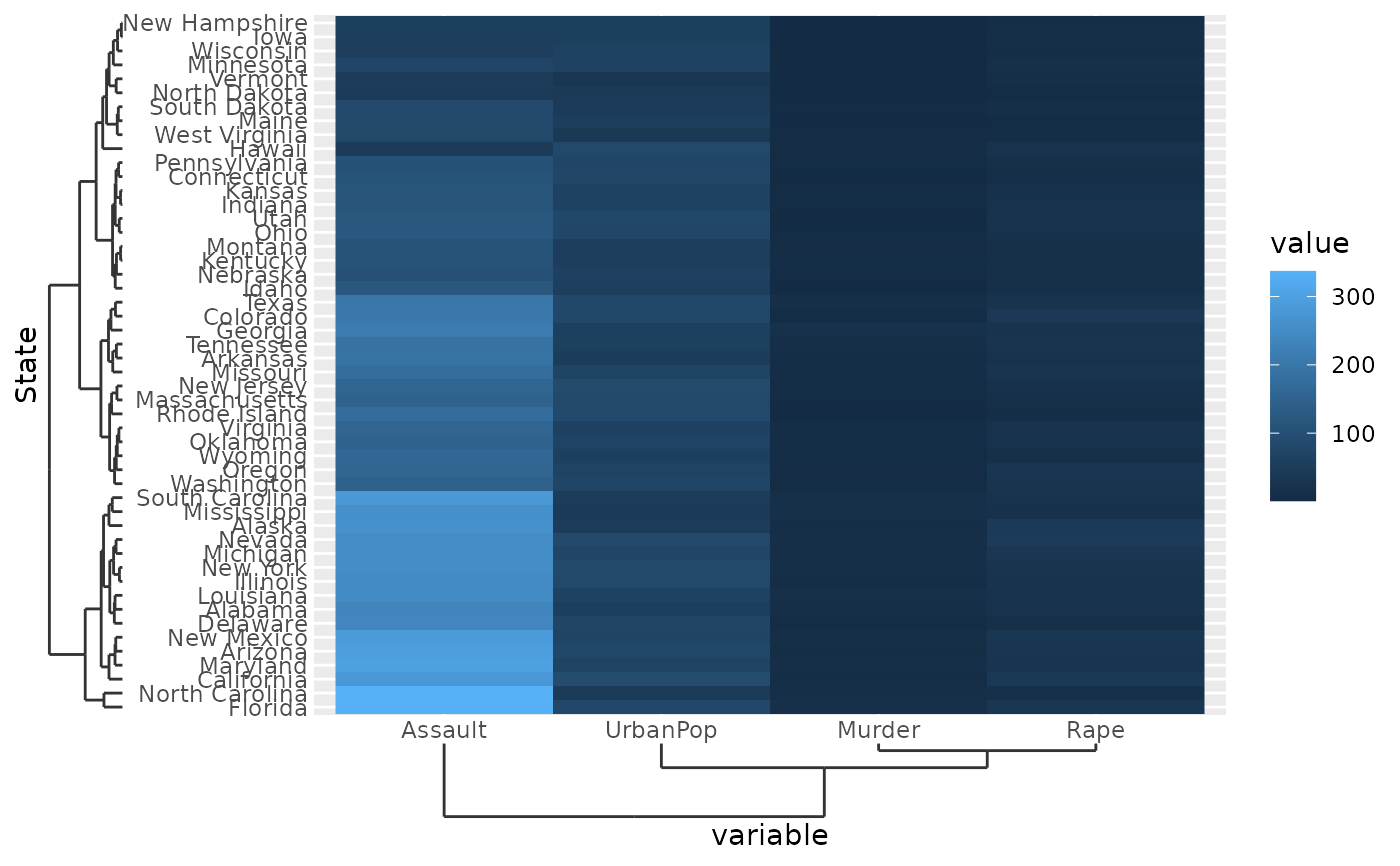
Examples
# Hierarchically cluster USArrests
yclus <- hclust(dist(USArrests), "ave")
xclus <- hclust(dist(t(USArrests)), "ave")

# Melting USArrests
df <- data.frame(
  State = rownames(USArrests)[row(USArrests)],
  variable = colnames(USArrests)[col(USArrests)],
  value = unname(do.call(c, USArrests))
)

# Supply the clustering to the scales
ggplot(df, aes(variable, State, fill = value)) +
  geom_raster() +
  scale_y_dendrogram(hclust = yclus) +
  scale_x_dendrogram(hclust = xclus)
#> Warning: `scale_x_dendrogram()` was deprecated in ggh4x 0.3.0.
#> ℹ Please use `legendry::scale_x_dendro()` instead.