![[Deprecated]](figures/lifecycle-deprecated.svg) This axis guide is probably best described as
This axis guide is probably best described as
ggplot2::annotation_logticks() but implemented as a guide instead
of a geom. The tick marks probably best suit log10 transformations.
The function is deprecated because ggplot2 implemented a better log tick
axis.
Arguments
- title
A character string or expression indicating a title of guide. If
NULL, the title is not shown. By default (waiver()), the name of the scale object or the name specified inlabs()is used for the title.- check.overlap
silently remove overlapping labels, (recursively) prioritizing the first, last, and middle labels.
- angle
Compared to setting the angle in
theme()/element_text(), this also uses some heuristics to automatically pick thehjustandvjustthat you probably want. Can be one of the following:NULLto take the angles andhjust/vjustdirectly from the theme.waiver()to allow reasonable defaults in special cases.A number representing the text angle in degrees.
- n.dodge
The number of rows (for vertical axes) or columns (for horizontal axes) that should be used to render the labels. This is useful for displaying labels that would otherwise overlap.
- order
A positive
integerof length 1 that specifies the order of this guide among multiple guides. This controls in which order guides are merged if there are multiple guides for the same position. If 0 (default), the order is determined by a secret algorithm.- position
Where this guide should be drawn: one of top, bottom, left, or right.
- prescaled
A
logicalof length one, indicating whether the data has been manually rescaled (TRUE) or the scale takes care of the transformation (FALSE).- trunc_lower, trunc_upper
The lower and upper range of the truncated axis:
NULLto not perform any truncation.A
functionthat takes the break positions as input and returns the lower or upper boundary. Note that also for discrete scales, positions are the mapped positions asnumeric.A
numericvalue in data units for the lower and upper boundaries.A
unitobject.
- colour, color
A
character(1)with a valid colour for colouring the axis text, axis ticks and axis line. Overrules the colour assigned by the theme.- base
When this is provided, the guide takes this as the base for the log transformation instead of trying to guess the base. It is recommended to use this argument if the base is not
10.
Theme elements
This axis guide uses the following the theme elements:
ggh4x.axis.ticks.length.minorAn
rel()object to set the size of minor ticks relative to the length of major ticks (axis.ticks.length). Defaults torel(2/3).ggh4x.axis.ticks.length.miniAn
rel()object to set the size of smallest ticks, also relative to the length of major ticks (axis.ticks.length). Defaults torel(1/3).
See also
Other axis-guides:
guide_axis_manual(),
guide_axis_minor(),
guide_axis_nested(),
guide_axis_scalebar(),
guide_axis_truncated()
Examples
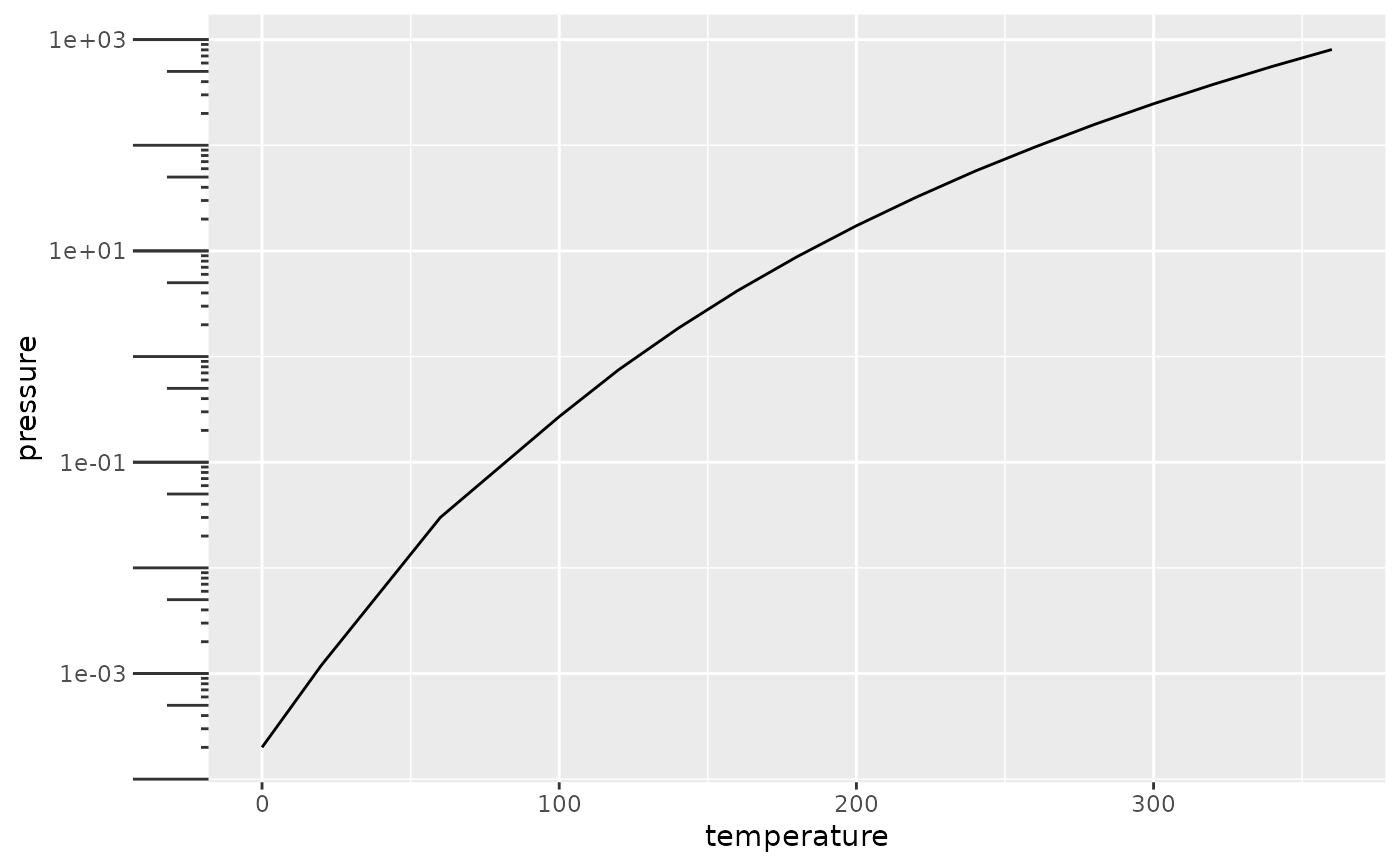
# The guide works well out of the box with log10 scales
p <- ggplot(pressure, aes(temperature, pressure)) +
geom_line()
p + scale_y_log10(guide = "axis_logticks")
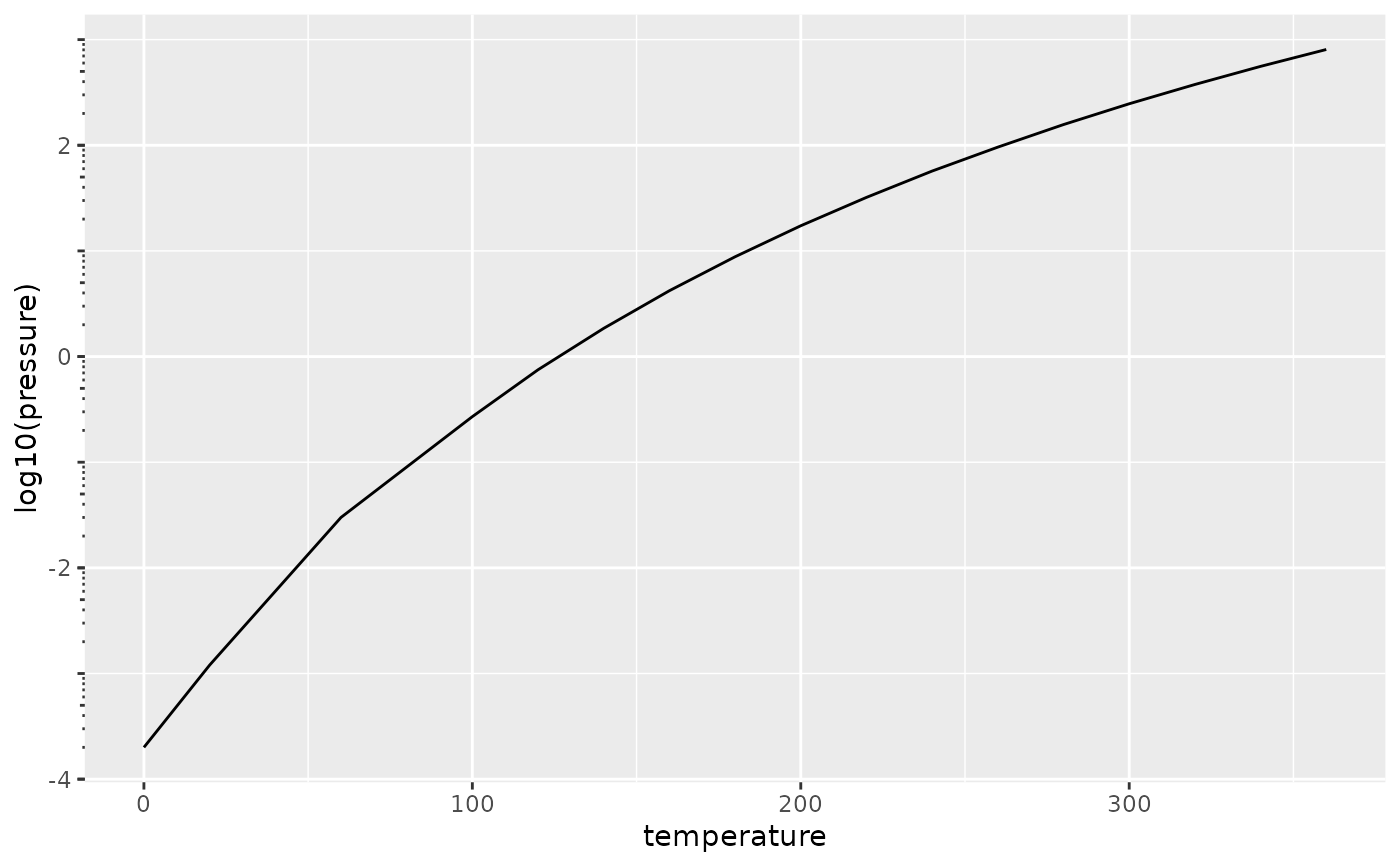
 # If the data is already transformed, you can set 'prescaled' to TRUE
ggplot(pressure, aes(temperature, log10(pressure))) +
geom_line() +
guides(y = guide_axis_logticks(prescaled = TRUE))
#> Warning: Ignoring unknown argument to `guide_axis_logticks()`: `prescaled`.
# If the data is already transformed, you can set 'prescaled' to TRUE
ggplot(pressure, aes(temperature, log10(pressure))) +
geom_line() +
guides(y = guide_axis_logticks(prescaled = TRUE))
#> Warning: Ignoring unknown argument to `guide_axis_logticks()`: `prescaled`.
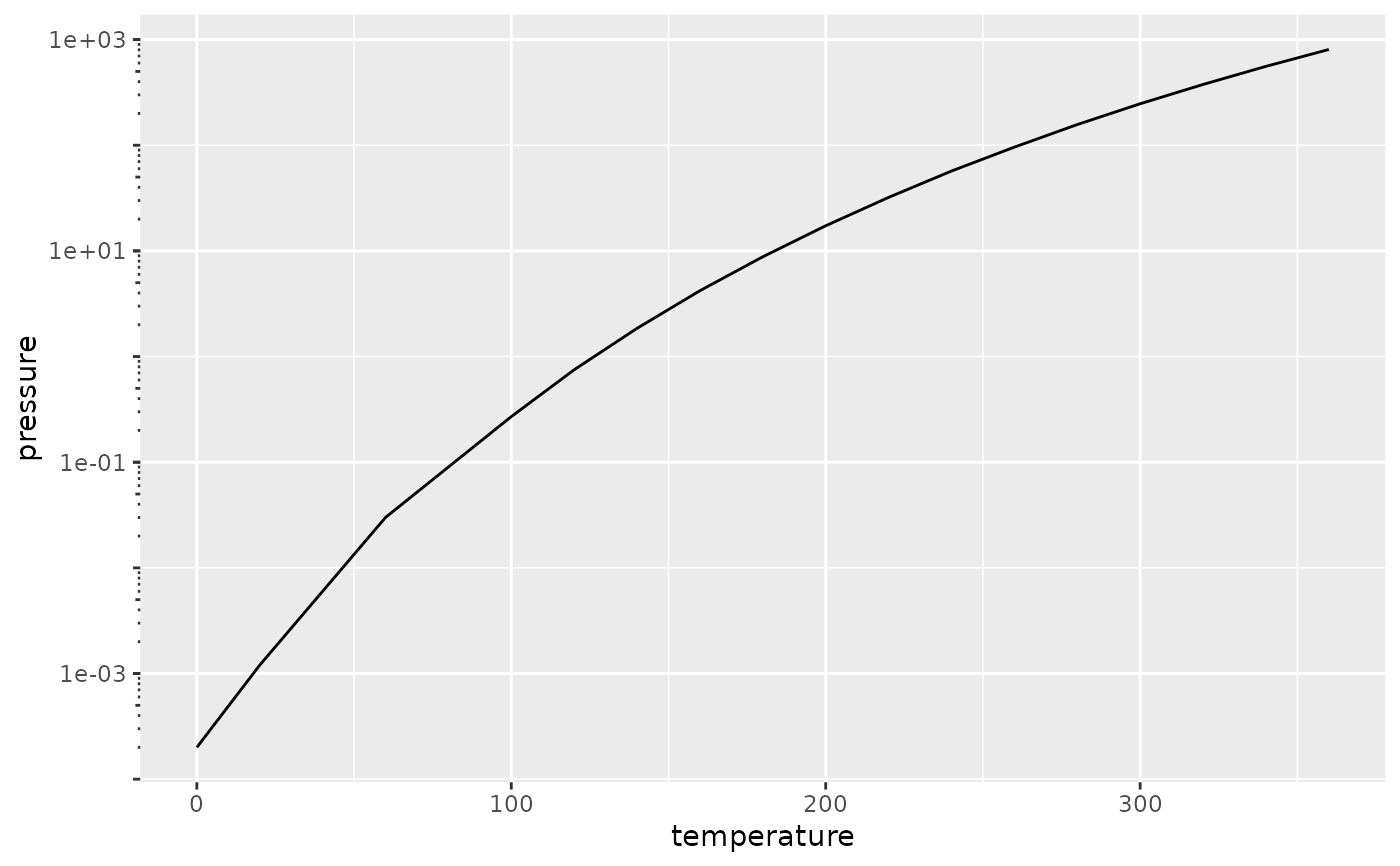
 # The lenghts of the log-ticks are controlled by the theme relative to the
# major ticks.
p + scale_y_log10(guide = "axis_logticks") +
theme(
axis.ticks.length.y = unit(1, "cm"),
ggh4x.axis.ticks.length.minor = rel(0.55),
ggh4x.axis.ticks.length.mini = rel(0.1)
)
# The lenghts of the log-ticks are controlled by the theme relative to the
# major ticks.
p + scale_y_log10(guide = "axis_logticks") +
theme(
axis.ticks.length.y = unit(1, "cm"),
ggh4x.axis.ticks.length.minor = rel(0.55),
ggh4x.axis.ticks.length.mini = rel(0.1)
)