This function behaves like ggplot2::facet_wrap(), but has a few
extra options on axis drawing when scales are fixed.
Usage
facet_wrap2(
  facets,
  nrow = NULL,
  ncol = NULL,
  scales = "fixed",
  axes = "margins",
  remove_labels = "none",
  shrink = TRUE,
  labeller = "label_value",
  as.table = TRUE,
  drop = TRUE,
  dir = "h",
  strip.position = "top",
  trim_blank = TRUE,
  strip = "vanilla"
)
Arguments
- facets
A set of variables or expressions quoted by
vars()and defining faceting groups on the rows or columns dimension. The variables can be named (the names are passed tolabeller).For compatibility with the classic interface, can also be a formula or character vector. Use either a one sided formula,
~a + b, or a character vector,c("a", "b").- nrow, ncol
Number of rows and columns.
- scales
A
character(1)orlogical(1)whether scales are shared across facets or allowed to vary. One of the following:"fixed"orFALSEScales are shared across all facets (default).
"free_x"x-scales are allowed to vary.
"free_y"y-scales are allowed to vary.
"free"orTRUEBoth scales can vary
- axes
A
character(1)orlogical(1)where axes should be drawn. One of the following:"margins"orFALSEOnly draw axes at the outer margins (default).
"x"Draw axes at the outer margins and all inner x-axes too.
"y"Draw axes at the outer margins and all inner y-axes too.
"all"orTRUEDraw the axes for every panel.
- remove_labels
A
character(1)orlogical(1)determining whether axis text is displayed at inner panels. One of the following:"none"orFALSEDisplay axis text at all axes (default).
"x"Display axis text at outer margins and all inner y-axes.
"y"Display axis text at outer margins and all inner x-axes.
"all"orTRUEOnly display axis text at the outer margins.
- shrink
If
TRUE, will shrink scales to fit output of statistics, not raw data. IfFALSE, will be range of raw data before statistical summary.- labeller
A function that takes one data frame of labels and returns a list or data frame of character vectors. Each input column corresponds to one factor. Thus there will be more than one with
vars(cyl, am). Each output column gets displayed as one separate line in the strip label. This function should inherit from the "labeller" S3 class for compatibility withlabeller(). You can use different labeling functions for different kind of labels, for example uselabel_parsed()for formatting facet labels.label_value()is used by default, check it for more details and pointers to other options.- as.table
If
TRUE, the default, the facets are laid out like a table with highest values at the bottom-right. IfFALSE, the facets are laid out like a plot with the highest value at the top-right.- drop
If
TRUE, the default, all factor levels not used in the data will automatically be dropped. IfFALSE, all factor levels will be shown, regardless of whether or not they appear in the data.- dir
Direction: either
"h"for horizontal, the default, or"v", for vertical.- strip.position
By default, the labels are displayed on the top of the plot. Using
strip.positionit is possible to place the labels on either of the four sides by settingstrip.position = c("top", "bottom", "left", "right")- trim_blank
A
logical(1). WhenTRUE(default), does not draw rows and columns containing no panels. WhenFALSE, thenrowandncolarguments are taken literally, even when there are more than needed to fit all panels.- strip
A strip specification as one of the following:
An object inheriting from
<Strip>, such as an object created withstrip_vanilla().A strip function, i.e.
strip_vanilla.A string giving such function without the
strip_-prefix, i.e."vanilla".
See also
Other facetting functions:
facet_grid2(),
facet_manual(),
facet_nested(),
facet_nested_wrap()
Examples
p <- ggplot(mpg, aes(displ, hwy)) + geom_point()
# Repeat all axes for every facet
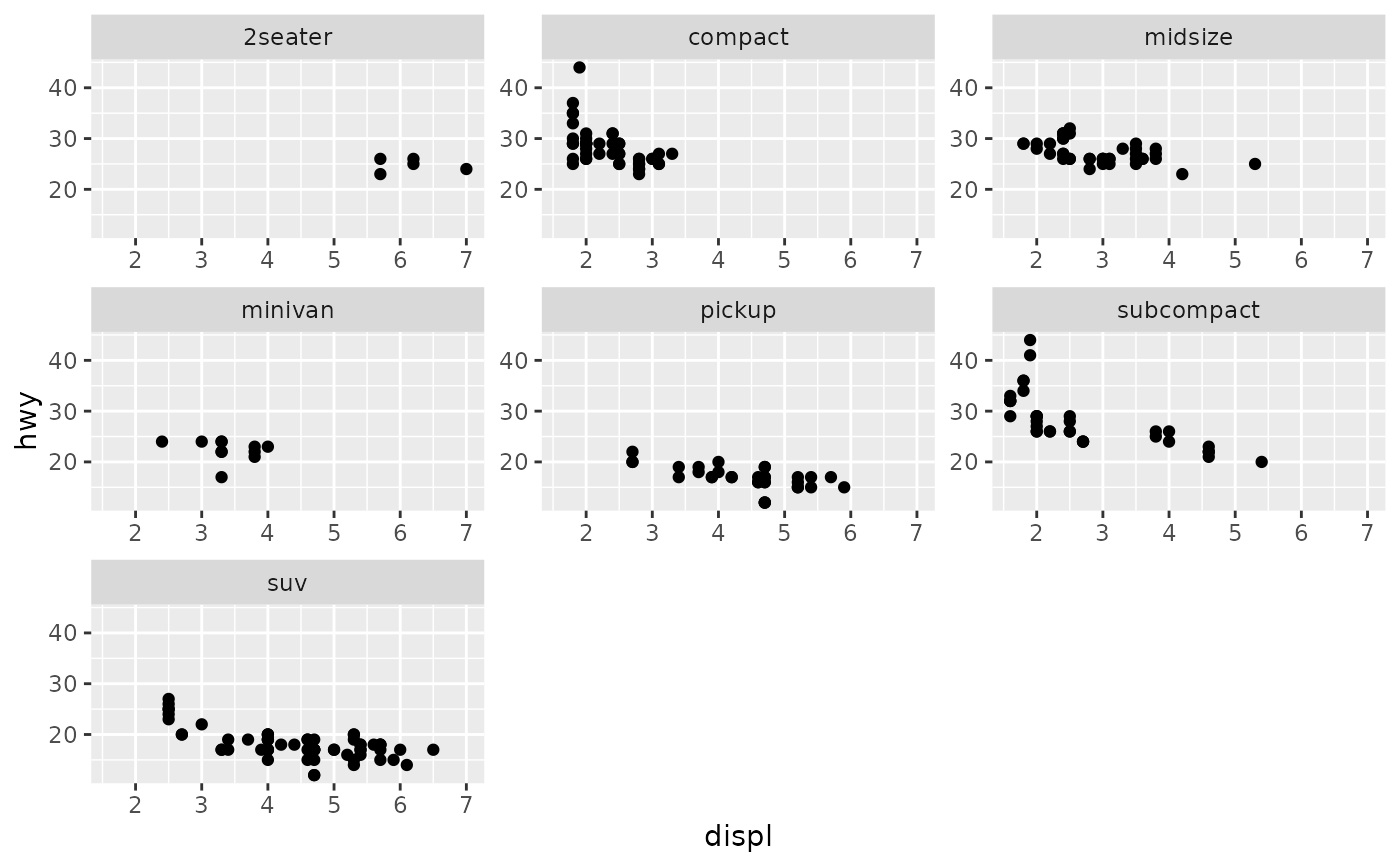
p + facet_wrap2(vars(class), axes = "all")
 # Repeat only y-axes
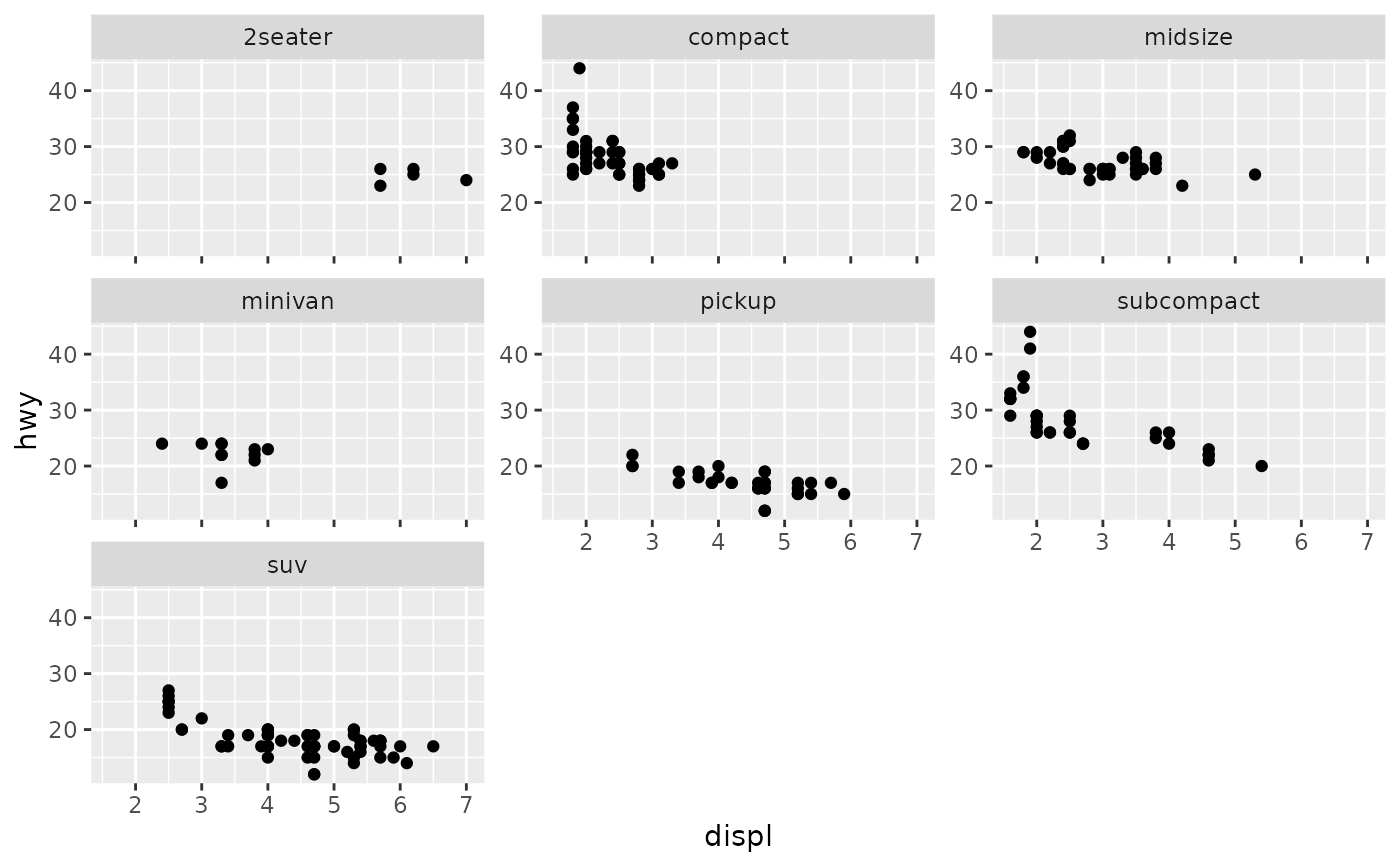
p + facet_wrap2(vars(class), axes = "y")
# Repeat only y-axes
p + facet_wrap2(vars(class), axes = "y")
 # Repeat axes without labels
p + facet_wrap2(vars(class), axes = "all", remove_labels = "all")
# Repeat axes without labels
p + facet_wrap2(vars(class), axes = "all", remove_labels = "all")
 # Repeat axes without x-axis labels
p + facet_wrap2(vars(class), axes = "all", remove_labels = "x")
# Repeat axes without x-axis labels
p + facet_wrap2(vars(class), axes = "all", remove_labels = "x")