These scales map the values of colour_spec vectors to coordinates in a colour space.

scale_colour_rgb(..., aesthetics = "colour")

scale_fill_rgb(..., aesthetics = "fill")

scale_colour_hsv(..., aesthetics = "colour")

scale_fill_hsv(..., aesthetics = "fill")

scale_colour_hsl(..., aesthetics = "colour")

scale_fill_hsl(..., aesthetics = "fill")

scale_colour_hcl(..., aesthetics = "colour")

scale_fill_hcl(..., aesthetics = "fill")

scale_colour_cmyk(..., aesthetics = "colour")

scale_fill_cmyk(..., aesthetics = "fill")

scale_colour_cmy(..., aesthetics = "colour")

scale_fill_cmy(..., aesthetics = "fill")

Arguments

...

Arguments passed on to chromatic_scale

palette

A palette function that when called with a colour_spec vector should return a vector of colours.

breaks

One of

  • NULL for no breaks.

  • waiver() for the default breaks computed by the transformation object.

  • A colour_spec vector. For continuous channels, must be a numeric channel. For discrete channels, a character channel. Channels can be padded with NAs if the desired breaks are of unequal length.

  • A function that uses the limits as input and returns breaks. Note that this is used for both continuous and discrete channels.

  • A named list with the names of channels with (1) a character or numeric vector giving the breaks for that channel or (2) a function to be applied to the limits of that channel or (3) NULL for no breaks in that channel. Channels whose names are absent in the list's names are treated with the waiver() option above.

labels

One of

  • NULL for no labels.

  • waiver() for the default labels. In case of continuous channels, these are passed through the format function of the transformation object.

  • A colour_spec vector with character vectors in the channels. The channels can be padded with NAs to match the length of channels with the most breaks.

  • A function that uses the breaks as input and returns labels. Note that this is used for both continuous and discrete channels.

  • A named list with the names of channels with (1) a character vector giving the labels for that channel or (2) a function to be applied to the breaks of that channel or (3) NULL for no labels in that channel. Channels whose names are absent in the list's names are treated with the waiver() option above.

limits

One of

  • NULL to use the default scale range.

  • A colour_spec vector. For continuous channels, must be a length 2 vector giving the minimum and maximum. For discrete channels, the relevant channel should define possible values. For mixed usage, the continuous limits can be padded with NAs.

  • A function that accepts the existing (automatic) limits and returns new limits. Note that this is used for both continuous and discrete channels.

  • A named list with names of channels with (1) a vector defining the limits or (2) a function to be applied to the natural limits. Channels whose names are absent in the list's names are treated with the NULL option above.

prototype

A function that serves as constructor for the specific colour_spec class.

channel_limits

One of:

  • A colour_spec vector of length 2 containing numeric channels that indicating the limits for each channel between 0-1.

  • A named list with channel names and length 1 or 2 numeric vectors that indicate the limits for that channel between 0-1.

scale_name

The name of the scale that should be used for error messages associated with this scale.

name

The name of the scale. Used as the axis or legend title. If waiver(), the default, the name of the scale is taken from the first mapping used for that aesthetic. If NULL, the legend title will be omitted.

n.breaks

An integer guiding the number of major breaks. The algorithm may choose a slightly different number to ensure nice break labels. Will only have an effect if breaks = waiver(). Use NULL to use the default number of breaks given by the transformation.

rescaler

A function used to scale the input values to the range [0, 1]. This is always scales::rescale(), except for diverging and n colour gradients (i.e., scale_colour_gradient2(), scale_colour_gradientn()). The rescaler is ignored by position scales, which always use scales::rescale().

oob

One of:

expand

For position scales, a vector of range expansion constants used to add some padding around the data to ensure that they are placed some distance away from the axes. Use the convenience function expansion() to generate the values for the expand argument. The defaults are to expand the scale by 5% on each side for continuous variables, and by 0.6 units on each side for discrete variables.

na.value

Missing values will be replaced with this value.

trans

For continuous scales, the name of a transformation object or the object itself. Built-in transformations include "asn", "atanh", "boxcox", "date", "exp", "hms", "identity", "log", "log10", "log1p", "log2", "logit", "modulus", "probability", "probit", "pseudo_log", "reciprocal", "reverse", "sqrt" and "time".A transformation object bundles together a transform, its inverse, and methods for generating breaks and labels. Transformation objects are defined in the scales package, and are called <name>_trans (e.g., scales::boxcox_trans()). You can create your own transformation with scales::trans_new().

guide

A function used to create a guide or its name. See guides() for more information.

super

The super class to use for the constructed scale

aesthetics

The names of the aesthetics that this scale works with.

Value

A ScaleChromatic ggproto object that can be added to a plot.

Note

Specifying limits, breaks and labels works slightly differently compared to ggplot2, as these are needed for every channel in a colour space. When providing these arguments as a vector, a colour_spec vector describing the arguments for all channels is expected. If provided a function, the function is applied to every channel. To make it easier to set these arguments for channels individually, the preferred way is to provide these arguments with a named list, wherein the names are the first letters of the channels. For example, you can set the following in scale_colour_hsv():

labels = list(h = scales::percent, v = c("First", "Second", "Third"))

To give the hue percent labels, use the default labels for saturation by omission, and set the literal labels for value.

Functions

  • scale_*_rgb(): Red, Green and Blue colour space.

  • scale_*_hsv(): Hue, Saturation and Value colour space.

  • scale_*_hsl(): Hue, Saturation and Lightness colour space.

  • scale_*_hcl(): Hue, Chroma and Luminance colour space.

  • scale_*_cmyk(): Cyan, Magenta, Yellow and Key (black) colour space.

  • scale_*_cmy(): Cyan, Magenta and Yellow colour space.

See also

The colour_spec page for creating colour_spec vectors.
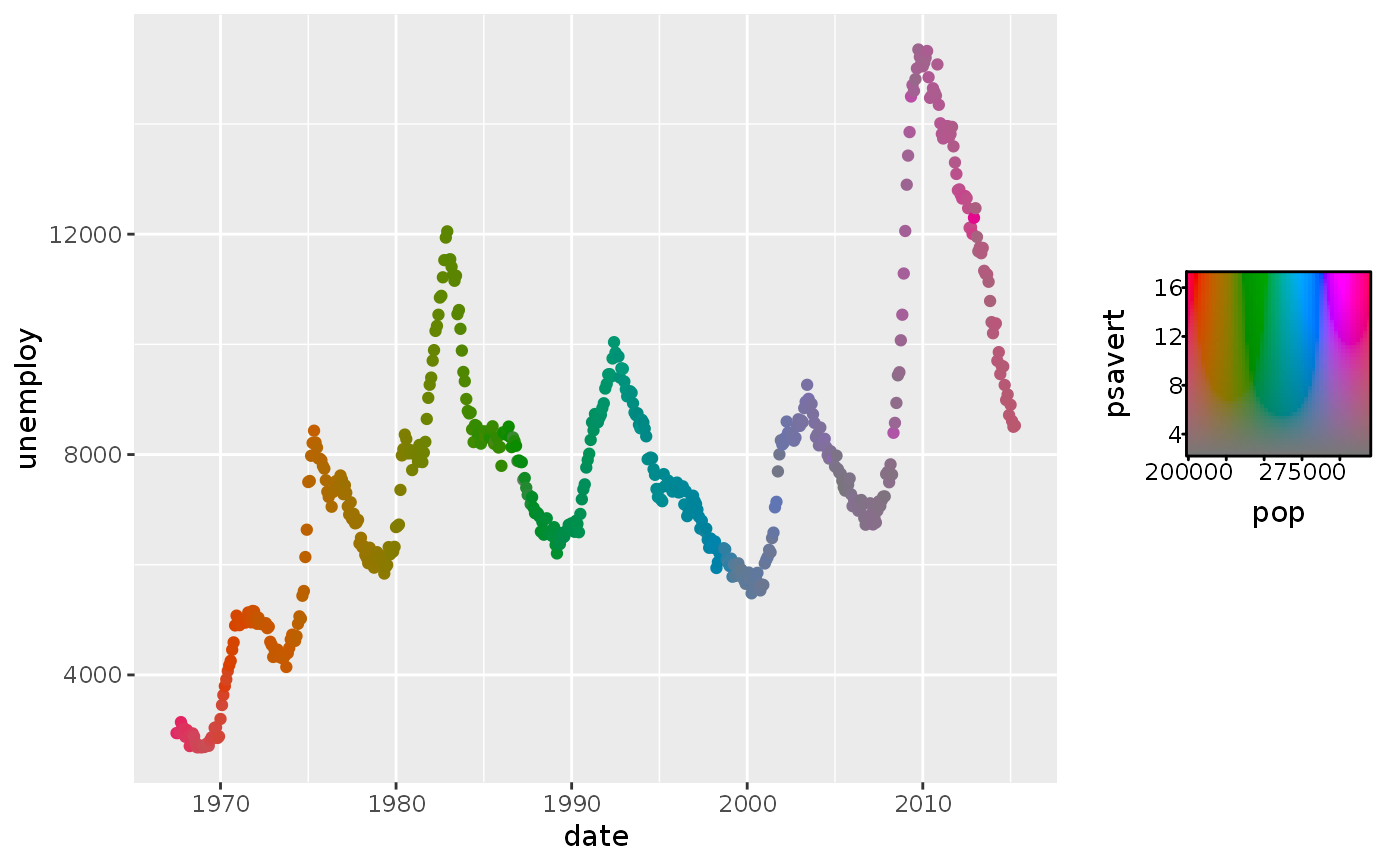
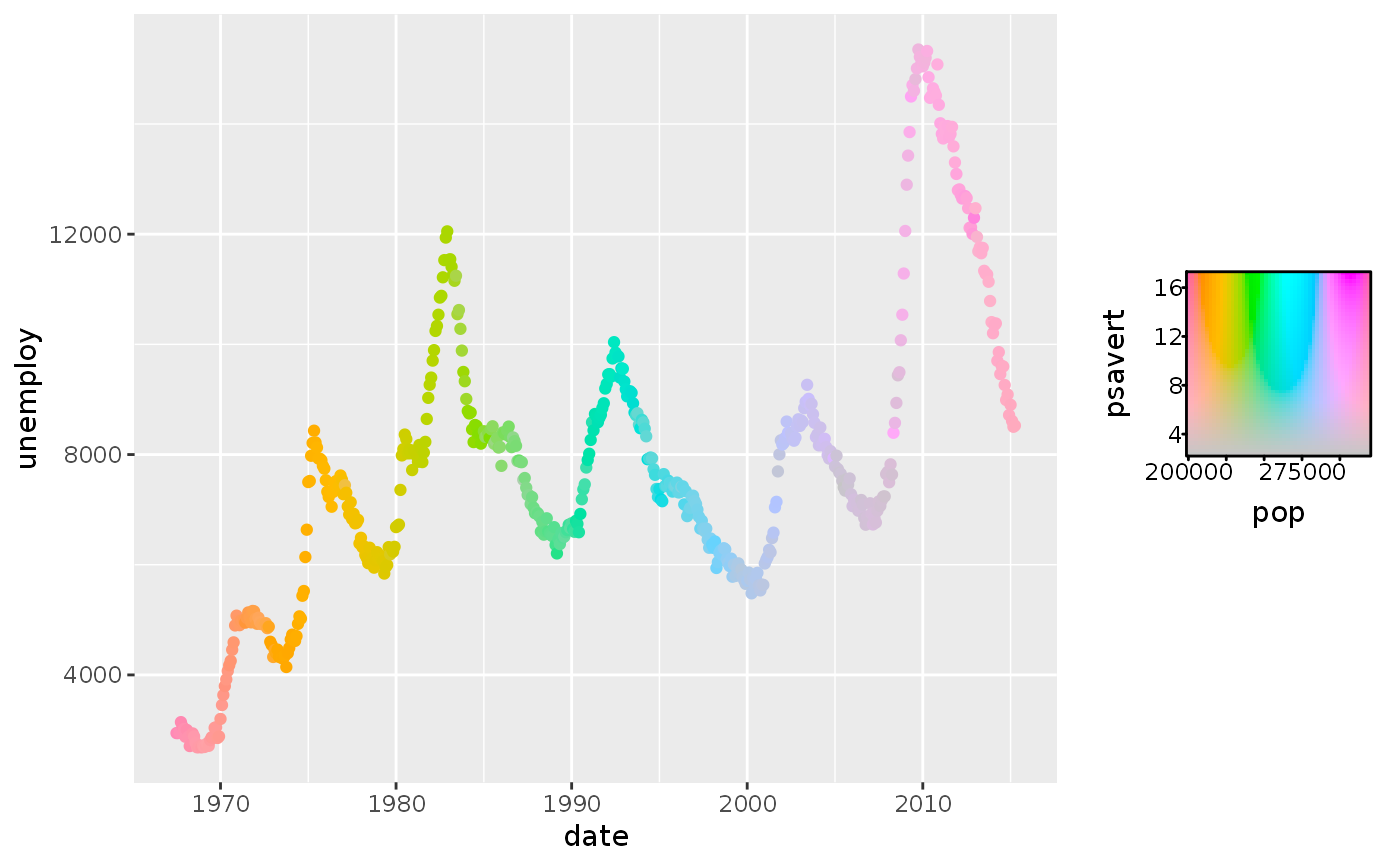
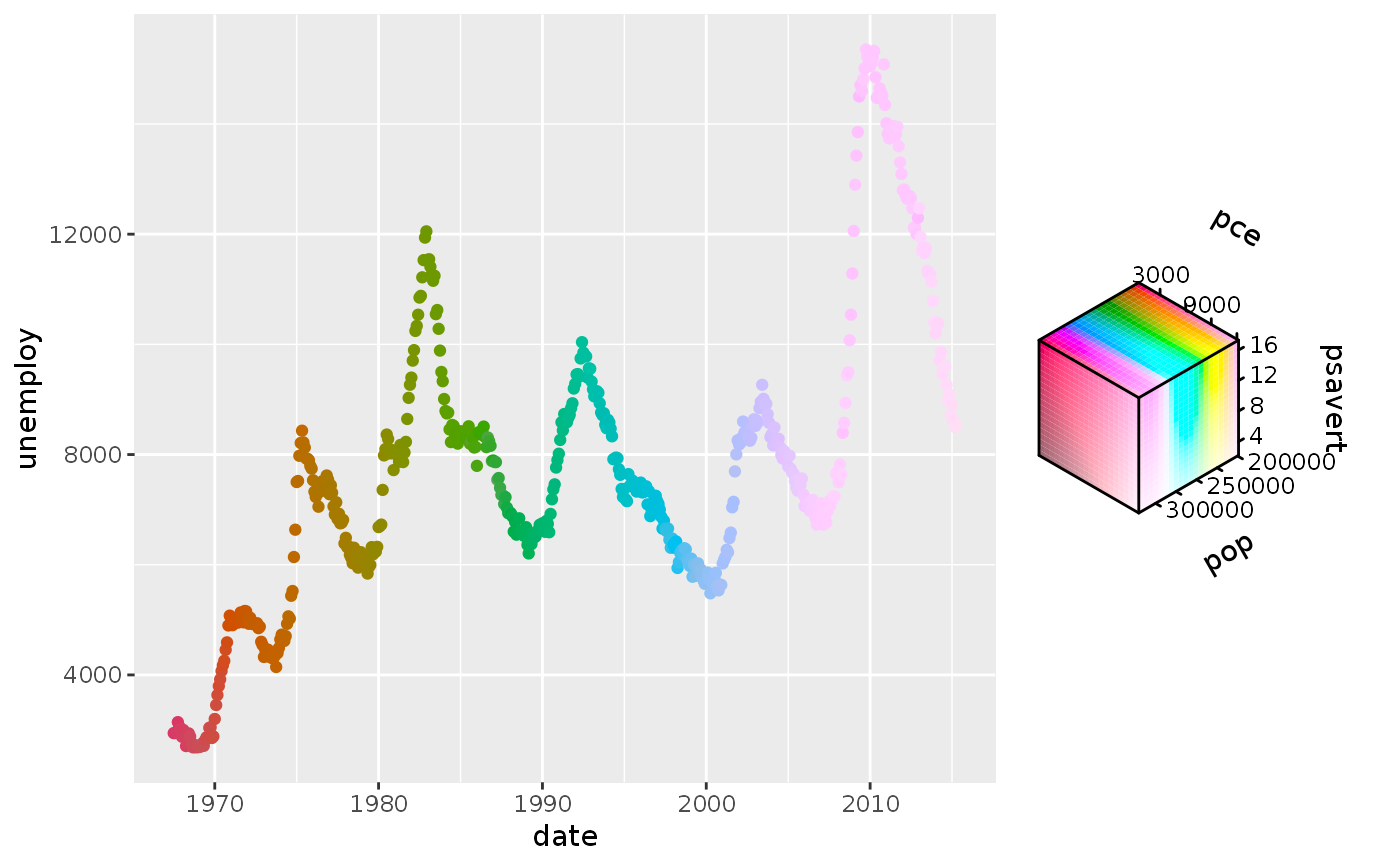
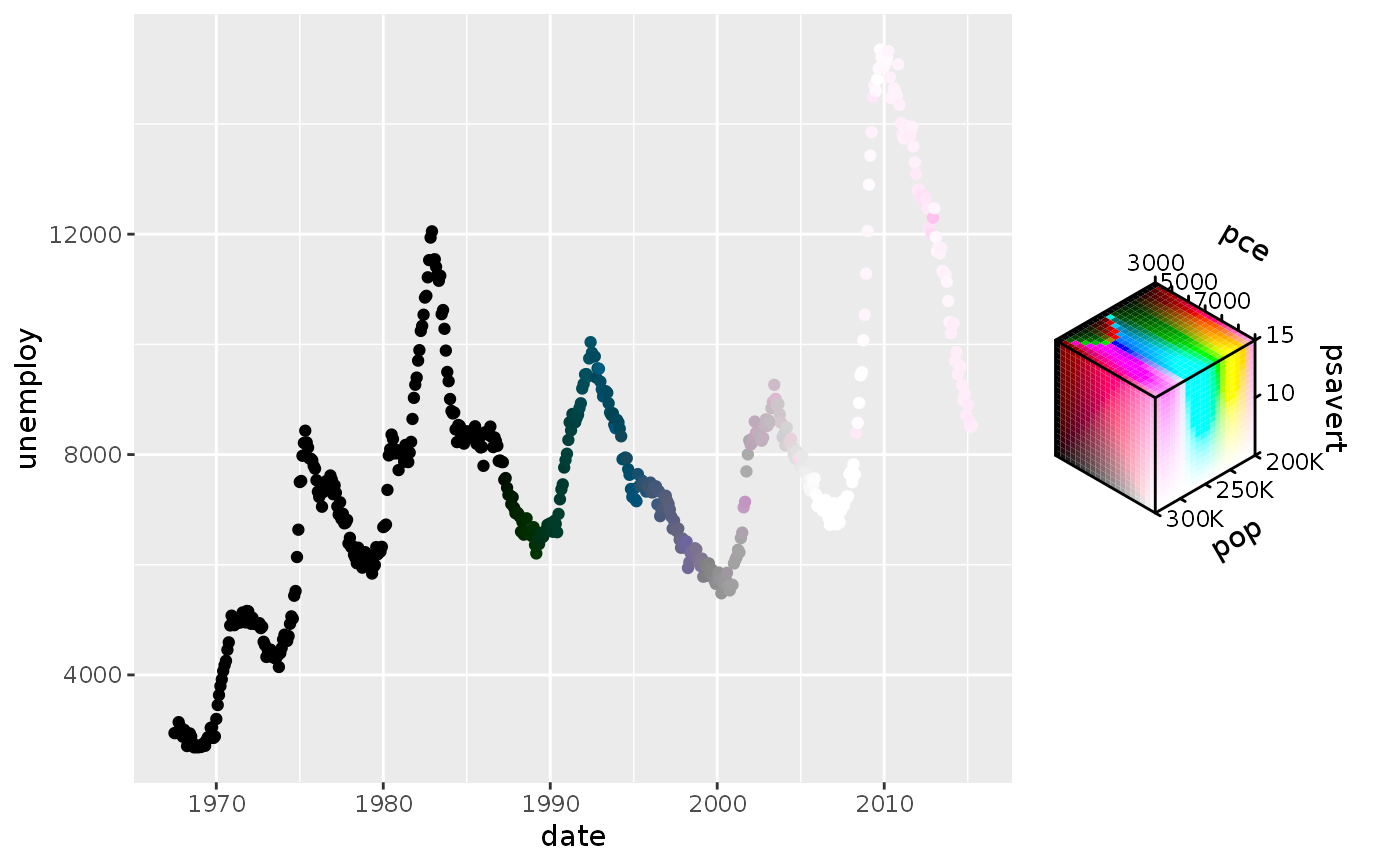
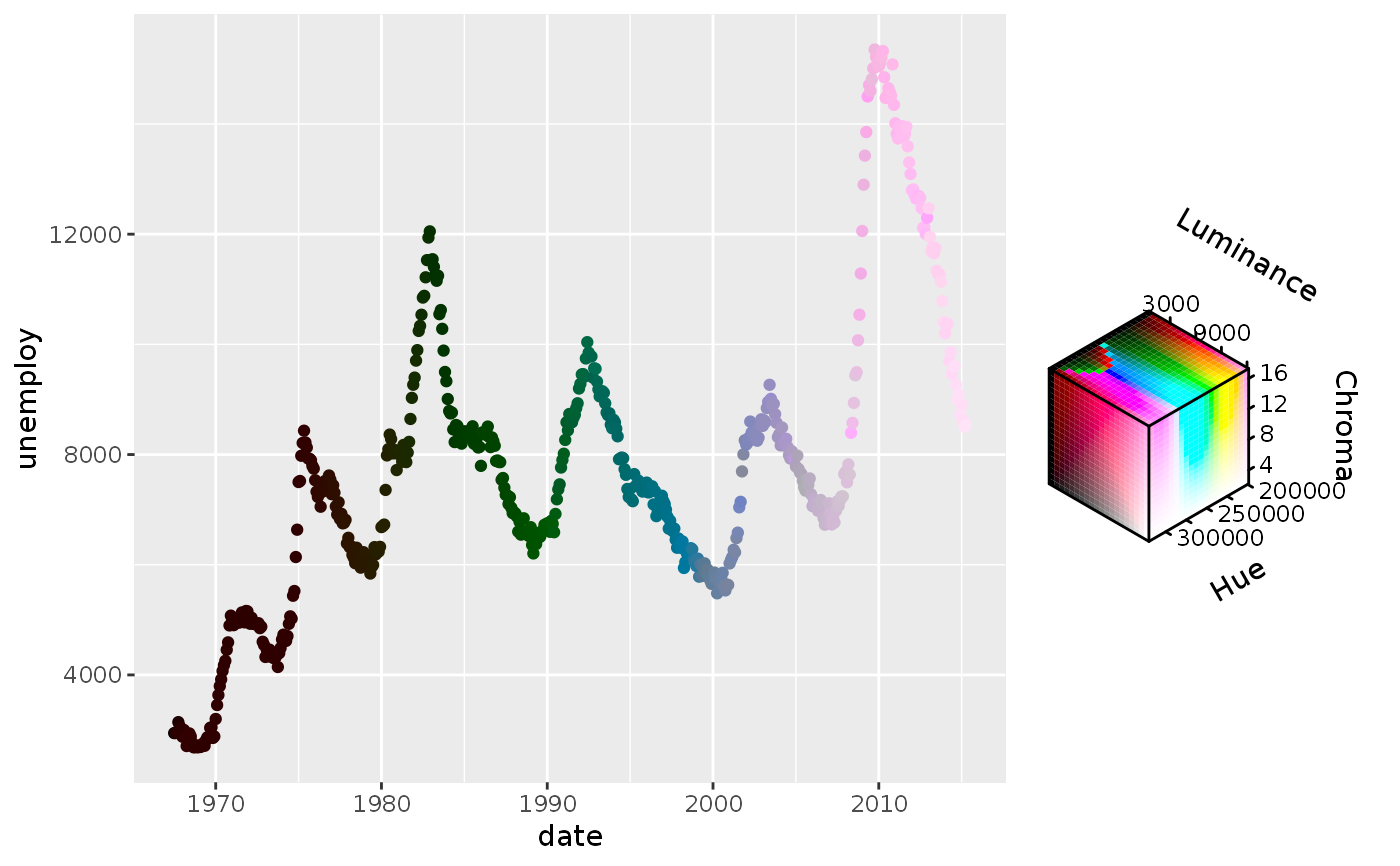
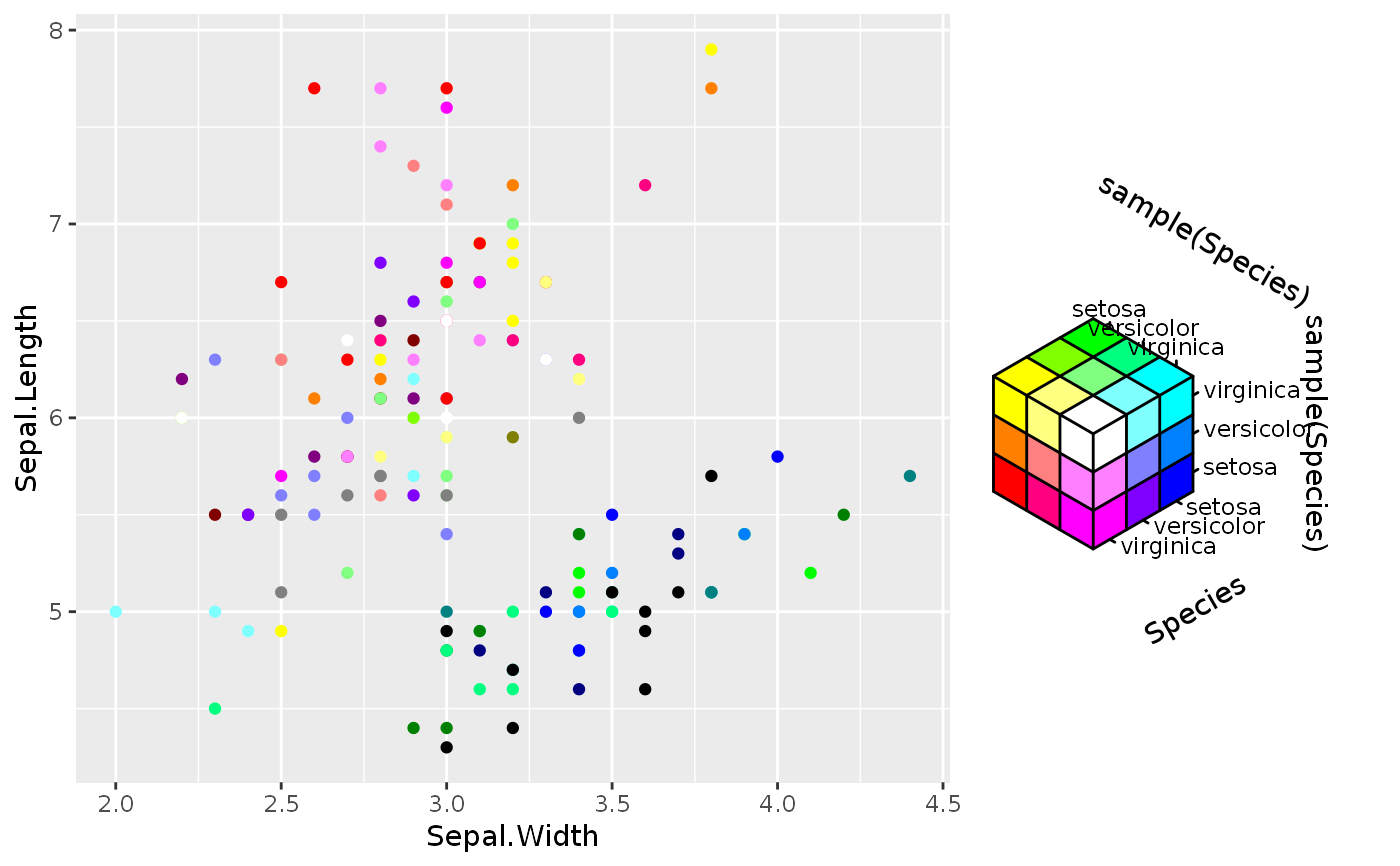
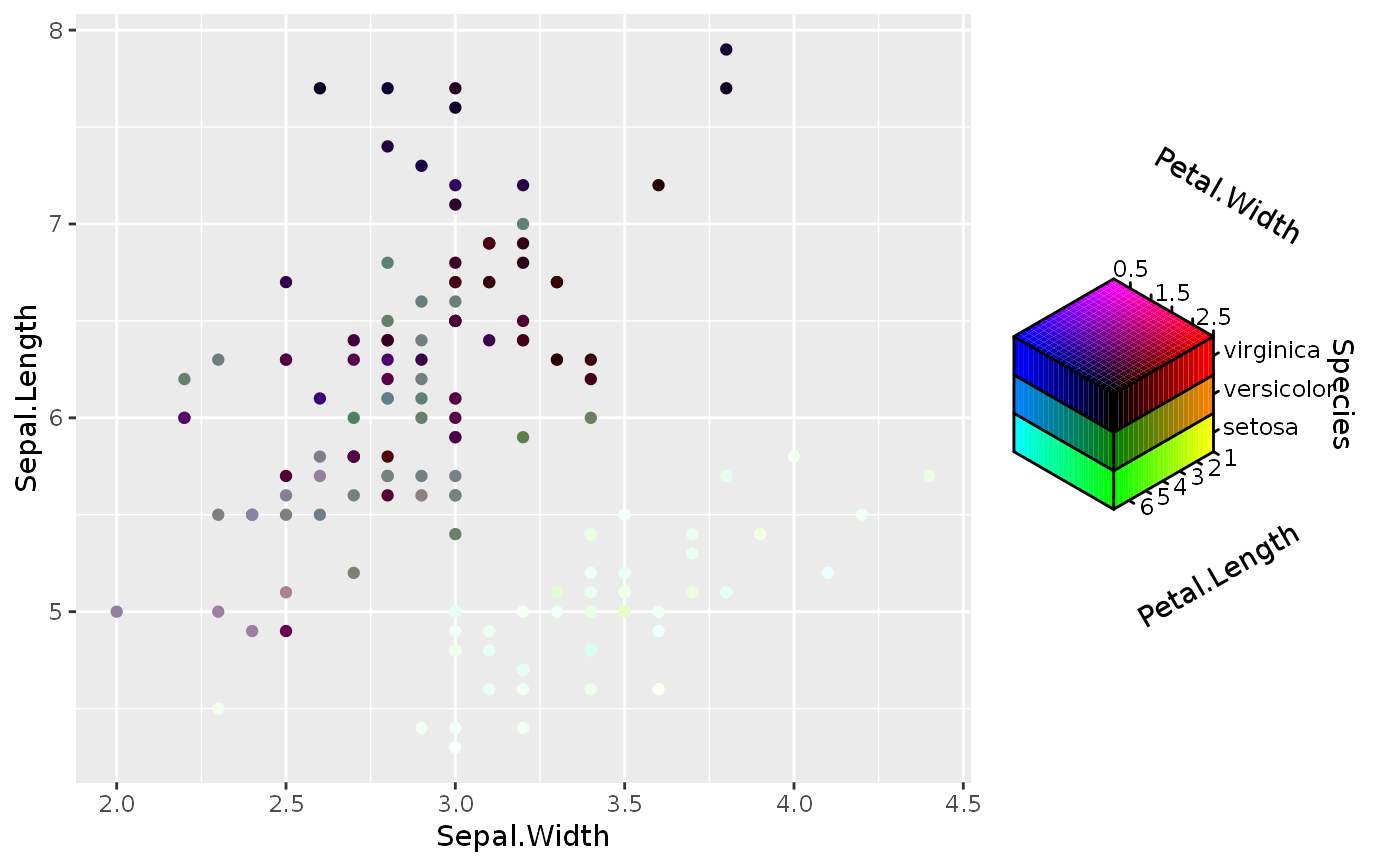
Examples

# Empty channels will take the midpoint of the channel limits. # Note that the 'luminance' channel is missing below. p <- ggplot(economics, aes(date, unemploy)) + geom_point(aes(colour = hcl_spec(pop, psavert))) p
# You can set the output of missing channels through the channel limits. # Setting 1 value fixes the output for that channel. p + scale_colour_hcl(channel_limits = list(l = 0.8))
# Alternatively, you can constrain the output of particular channels. # Setting 2 values between 0-1 restricts the channel output range. p <- ggplot(economics, aes(date, unemploy)) + geom_point(aes(colour = hcl_spec(pop, psavert, pce))) p + scale_colour_hcl(channel_limits = list(l = c(0.5, 1), c = c(0.2, 0.8)))
# Setting breaks, labels and limits through named lists p + scale_colour_hcl( breaks = list(c = c(5, 10, 15)), labels = list(h = scales::number_format(scale = 1e-3, suffix = "K")), limits = list(h = c(200e3, 300e3), c = c(5, 15), l = c(3000, 9000)), oob = scales::oob_squish )
# Scale can have names for every channel to be displayed in the guide p + scale_colour_hcl(name = c("Hue", "Chroma", "Luminance"))
# Scale can handle all-discrete variables p <- ggplot(iris, aes(Sepal.Width, Sepal.Length)) p + geom_point(aes(colour = rgb_spec(Species, sample(Species), sample(Species))))
# Or can handle a mix between discrete and continuous p + geom_point(aes(colour = cmy_spec(Petal.Length, Species, Petal.Width)))