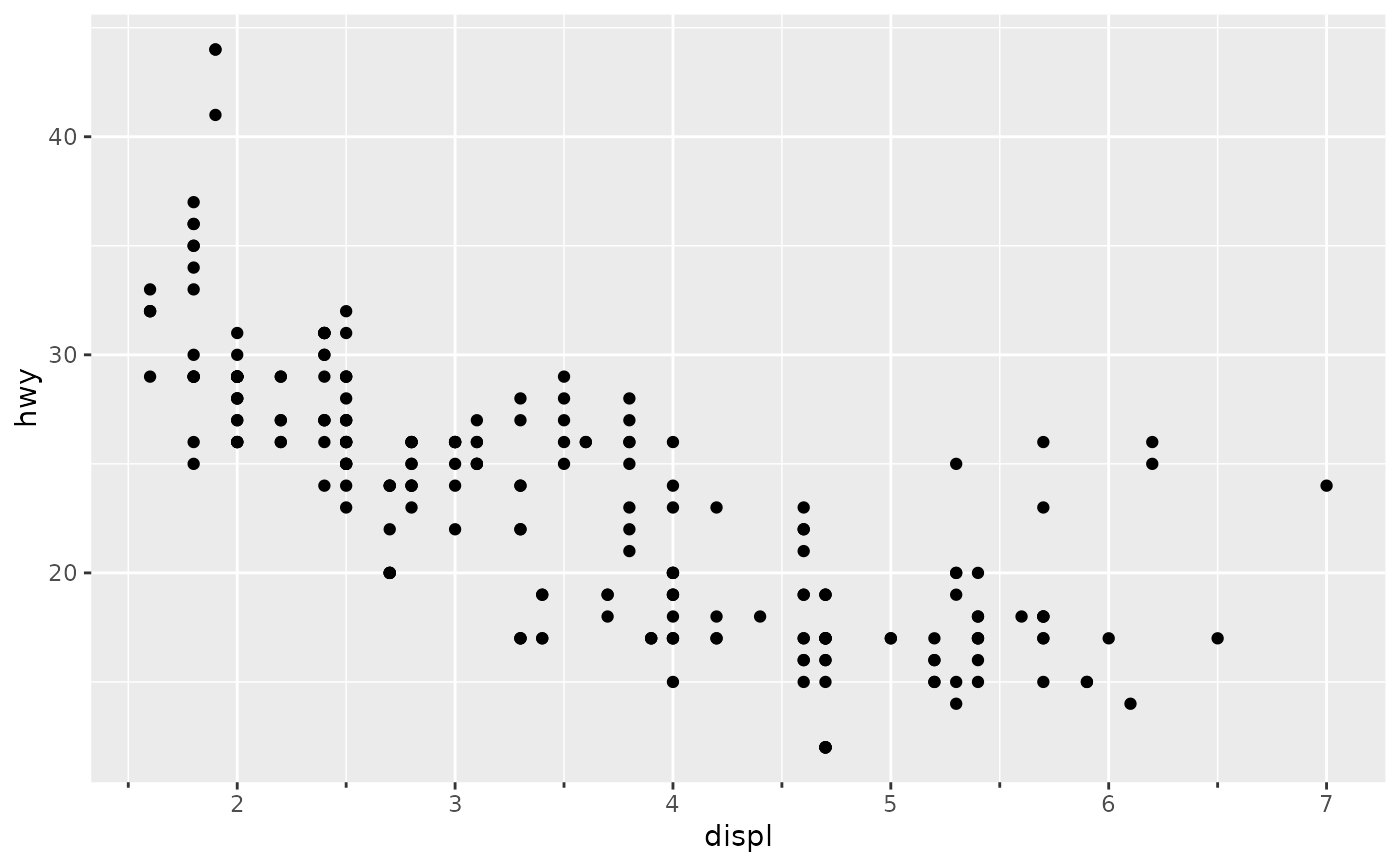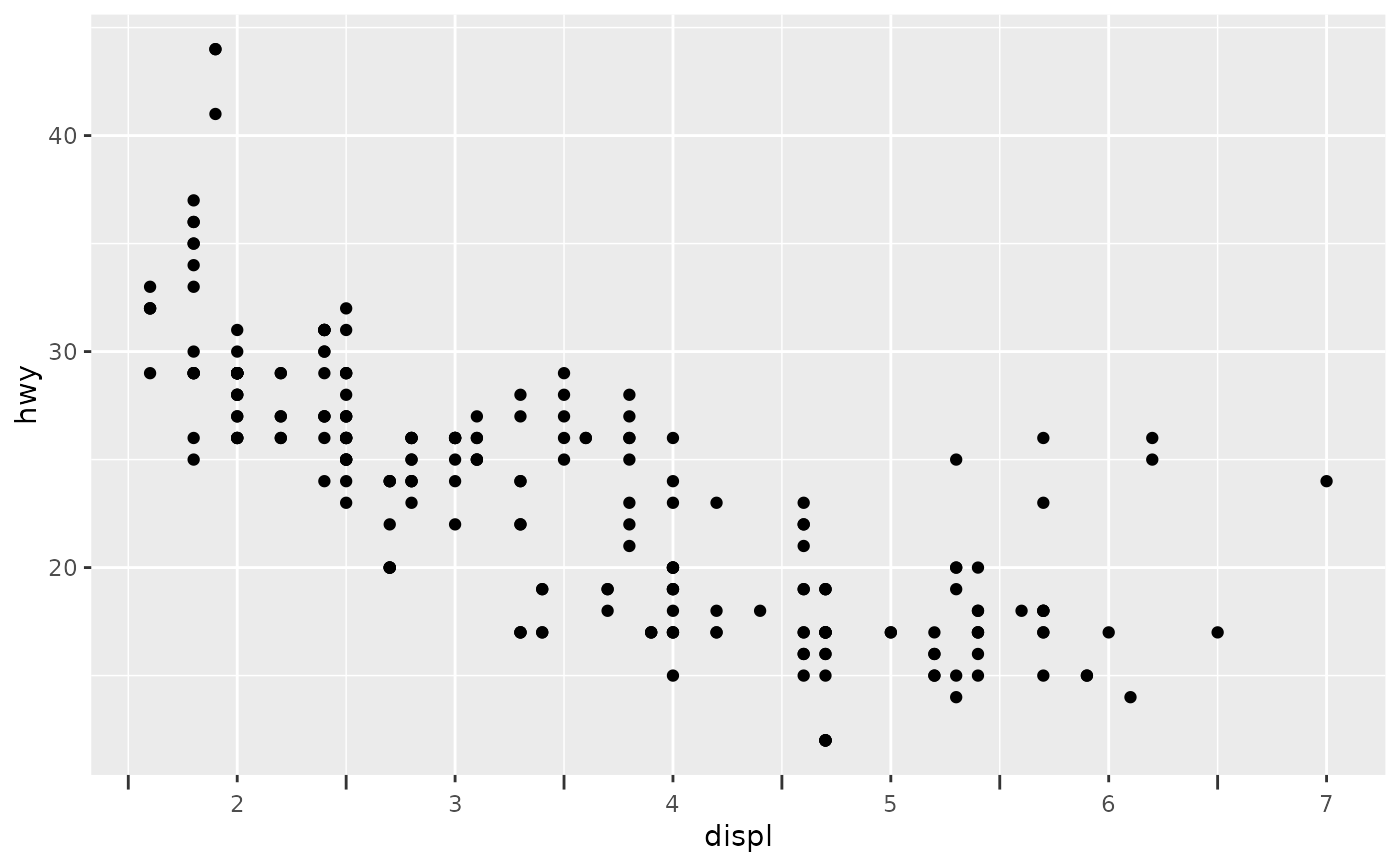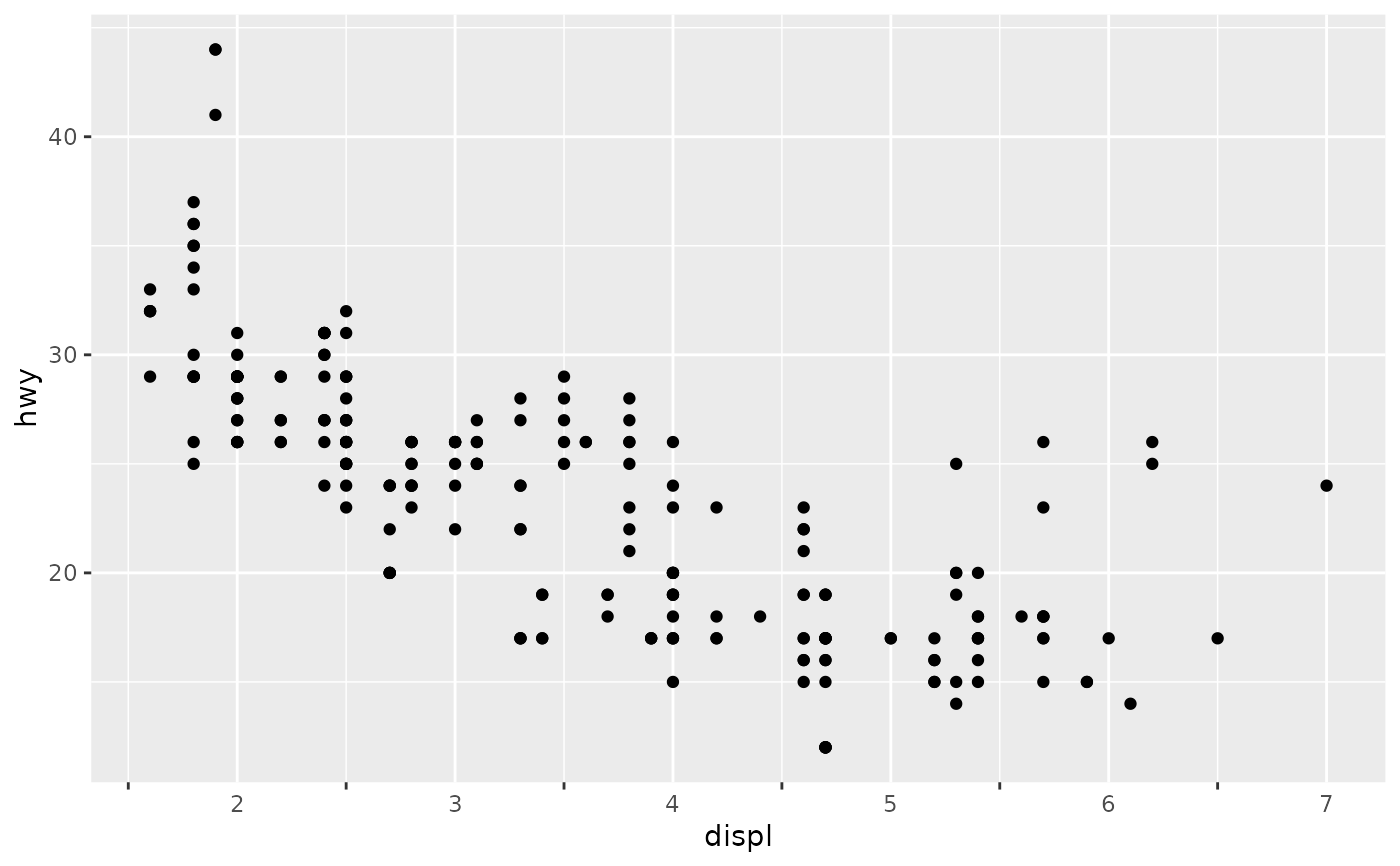
Axis guide with ticks for minor breaks
guide_axis_minor.RdThis is very similar to a regular axis guide, with the addition that it
also places tick marks at minor break locations. The minor_breaks argument
to scale_{x/y}_continuous() controls
where the breaks are placed.
Arguments
- minor_size
A
numeric(1)giving the relative size of minor axis ticks relative to major axis ticks, as defined by theaxis.ticks.length.{x/y}.{position}theme element. IfNULL(default), minor axis ticks are not shown.- major_size
A
numeric(1)giving the relative size of major ticks relative to theaxis.ticks.length.{x/y}.{position}theme element. IfNULL(default), major ticks are drawn to the theme's length.- ...
Arguments passed on to
guide_axis_extendsubtitleA
character()orexpression()giving a subtitle for the guide. IfNULL(default), no subtitle will be shown. Iflength(subtitle) > 1, text will be distributed over axis andhjustsetting will be ignored.subtitle.themeAn
<element_text>object or<element_blank>object controlling the appearance of thesubtitleargument. By default, it inherits from the relevantaxis.text.{x/y}.{position}theme setting.cap_lower,cap_upperA way to set the lower and upper ranges for axis capping Can be one of the following:
NULLto not perform any axis capping.A
functionthat takes the break positions as input and returns the lower or upper boundary. Note that also for discrete scales, the inputs are the mapped breaks, which arenumeric. Afunctioninput can also be given as lambda syntax.A
numericvalue, in data units, for the lower and upper boundaries.A
<unit>object to set the boundaries independent of any data.
colour,colorA
character(1)with a valid colour for simultaneously changing the colour or the axis text, axis ticks and axis line. IfNULL(default), inherit colours directly from the theme. Otherwise, theme settings are overruled.titleA character string or expression indicating a title of guide. If
NULL, the title is not shown. By default (waiver()), the name of the scale object or the name specified inlabs()is used for the title.check.overlapsilently remove overlapping labels, (recursively) prioritizing the first, last, and middle labels.
angleCompared to setting the angle in
theme()/element_text(), this also uses some heuristics to automatically pick thehjustandvjustthat you probably want.n.dodgeThe number of rows (for vertical axes) or columns (for horizontal axes) that should be used to render the labels. This is useful for displaying labels that would otherwise overlap.
orderA positive
integerof length 1 that specifies the order of this guide among multiple guides. This controls in which order guides are merged if there are multiple guides for the same position. If 0 (default), the order is determined by a secret algorithm.positionWhere this guide should be drawn: one of top, bottom, left, or right.
Value
A <Guide> ggproto object that can be given to the
guides() function, or set as the guide argument
in a position scale.
See also
Other axis variants:
guide_axis_cap(),
guide_axis_extend(),
guide_axis_nested(),
guide_axis_table()


