These geoms closely follow geom_rect() and geom_tile() but take
defaults from the theme and are drawn through theme elements. They use the
elementalist.geom_rect theme element.
geom_rect_theme(
  mapping = NULL,
  data = NULL,
  stat = "identity",
  position = "identity",
  ...,
  linejoin = "mitre",
  na.rm = FALSE,
  show.legend = NA,
  inherit.aes = TRUE,
  element = NULL
)

geom_tile_theme(
  mapping = NULL,
  data = NULL,
  stat = "identity",
  position = "identity",
  ...,
  linejoin = "mitre",
  na.rm = FALSE,
  show.legend = NA,
  inherit.aes = TRUE,
  element = NULL
)
Arguments
| mapping | Set of aesthetic mappings created by |
|---|---|
| data | The data to be displayed in this layer. There are three options: If A A |
| stat | The statistical transformation to use on the data for this layer, as a string. |
| position | Position adjustment, either as a string, or the result of a call to a position adjustment function. |
| ... | Other arguments passed on to |
| linejoin | Line join style (round, mitre, bevel). |
| na.rm | If |
| show.legend | logical. Should this layer be included in the legends?
|
| inherit.aes | If |
| element | An |
Value
A LayerInstance object that can be added to a plot.
Aesthetics
geom_tile_theme() understands the following aesthetics (required aesthetics are in bold):
xyalphacolourfillgroupheightlinetypesizewidth
Learn more about setting these aesthetics in vignette("ggplot2-specs").
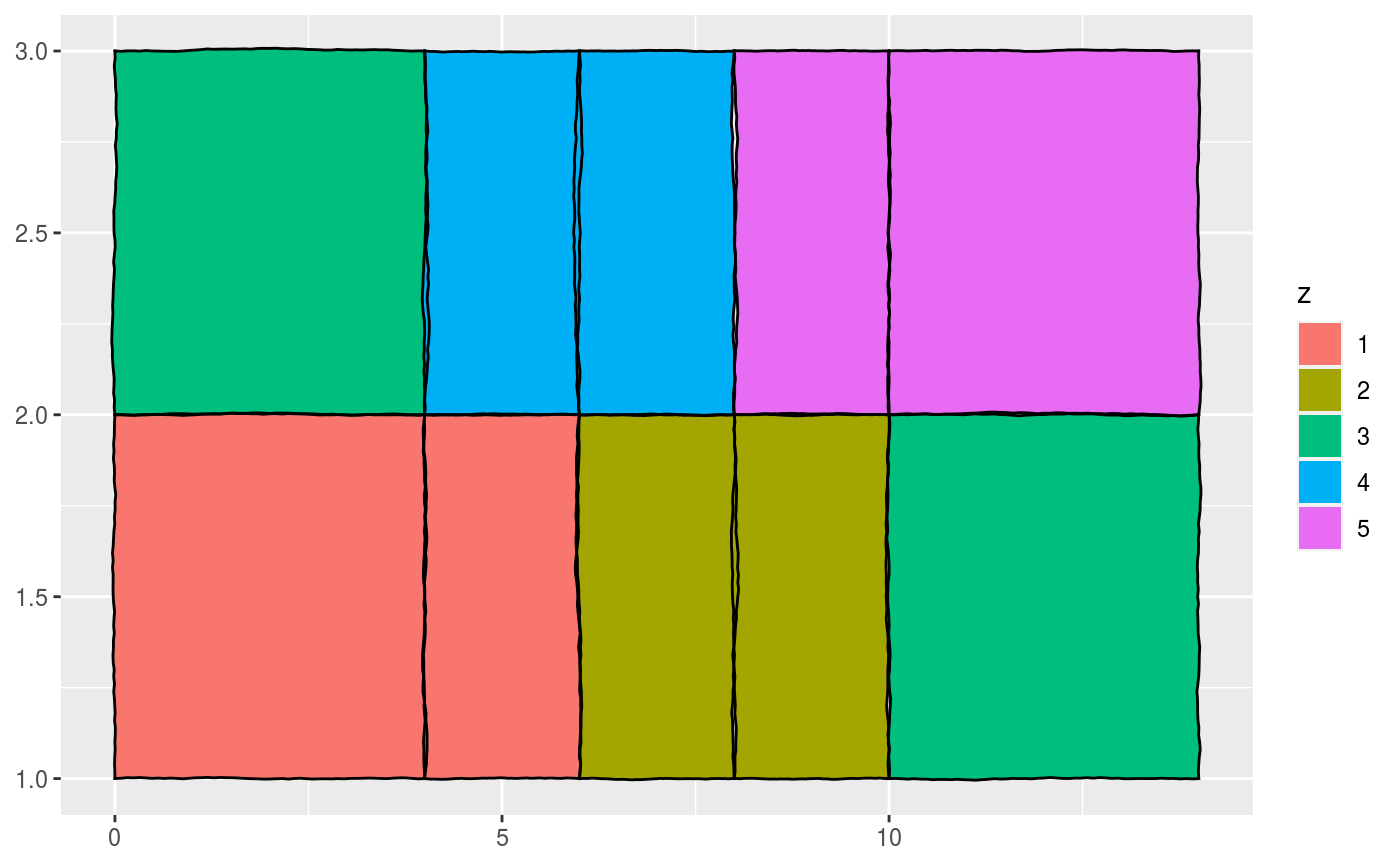
Examples
df <- data.frame( x = rep(c(2, 5, 7, 9, 12), 2), y = rep(c(1, 2), each = 5), z = factor(rep(1:5, each = 2)), w = rep(diff(c(0, 4, 6, 8, 10, 14)), 2) ) ggplot(df, aes(xmin = x - w / 2, xmax = x + w / 2, ymin = y, ymax = y + 1)) + geom_rect_theme(aes(fill = z)) + theme(elementalist.geom_rect = element_rect_wiggle())ggplot(df, aes(x, y, width = w)) + geom_tile_theme(aes(fill = z)) + theme(elementalist.geom_rect = element_rect_multicolour())