Interpolates lines and colour vectors, creating a gradient-like line. The functions are used in the following way:
multicolour()is a function factory that produces a function that is subsequently used in elements to make lines multicolour.
element_rect_multicolour(), element_line_multicolourare convenience wrappers around element_*_seq() that pass down the
function generated by multicolour().
multicolour_geoms()is a convenience theme setter for the
elementalist.geom_rect and elementalist.geom_line elements.
multicolour()

element_line_multicolour(colour = rainbow(10), ...)

element_rect_multicolour(colour = rainbow(10), ...)

multicolour_geoms(
  fill = NULL,
  colour = rainbow(10),
  size = NULL,
  linetype = NULL,
  color = NULL,
  lineend = NULL,
  sides = "tlbr",
  n = 50
)
Arguments
| colour | A |
|---|---|
| ... | Arguments passed to |
| fill | Fill colour. |
| size | Line/border size in mm; text size in pts. |
| linetype | Line type. An integer (0:8), a name (blank, solid, dashed, dotted, dotdash, longdash, twodash), or a string with an even number (up to eight) of hexadecimal digits which give the lengths in consecutive positions in the string. |
| color | Line/border colour. Color is an alias for colour. |
| lineend | Line end Line end style (round, butt, square) |
| sides | A |
| n | An |
Value
For multicolour(), a function.
For element_rect_multicolour(), an element_rect_seq
type list.
For element_line_multicolour(), an element_line_seq
type list.
For multicolour_geoms, a partial theme object.
Details
The multicolour function is a function factory that produces
a function, that subsequently can be used to gradient-colour lines.
For the element_rect_multicolour() the gradient is applied to each
side separately.
See also
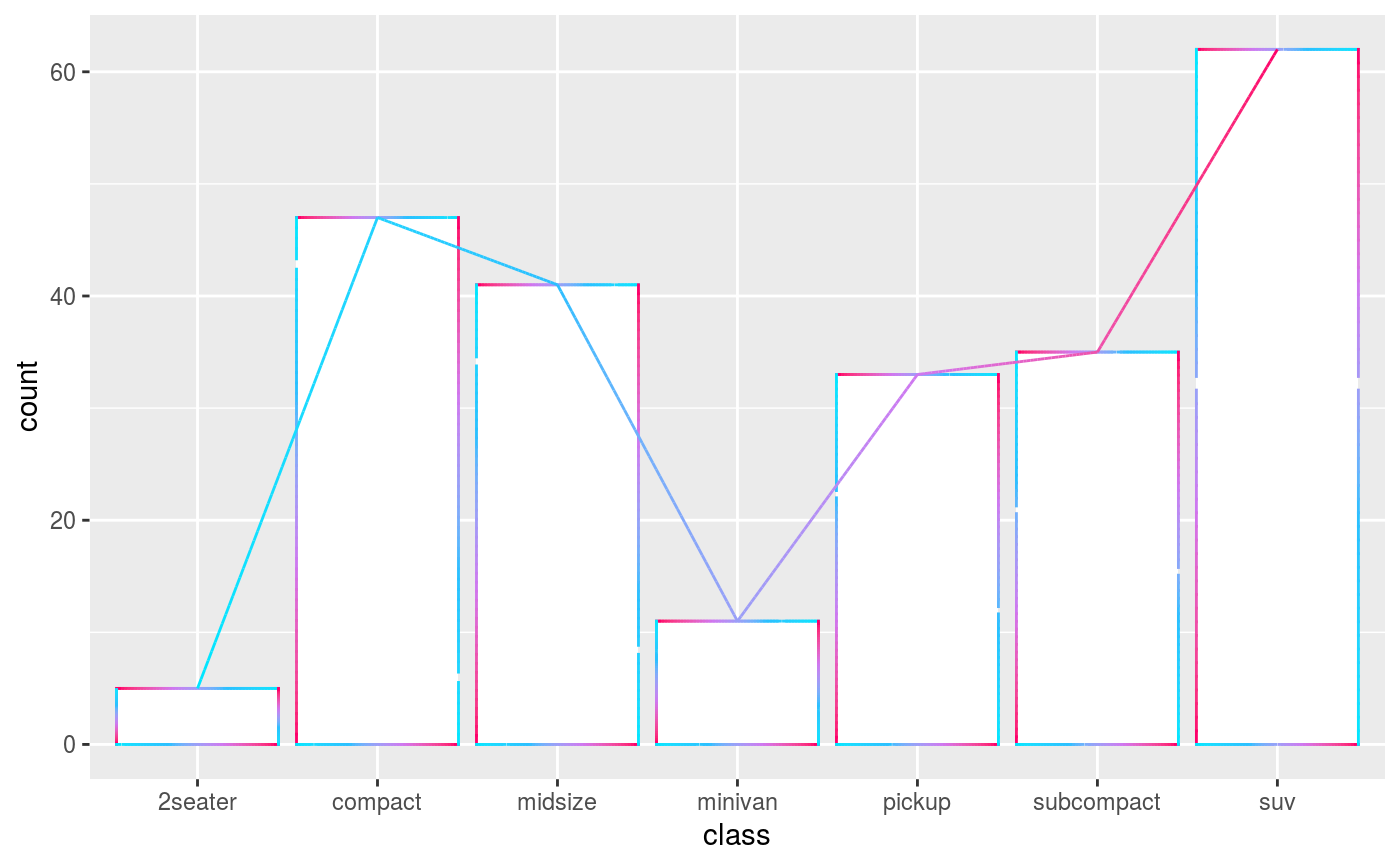
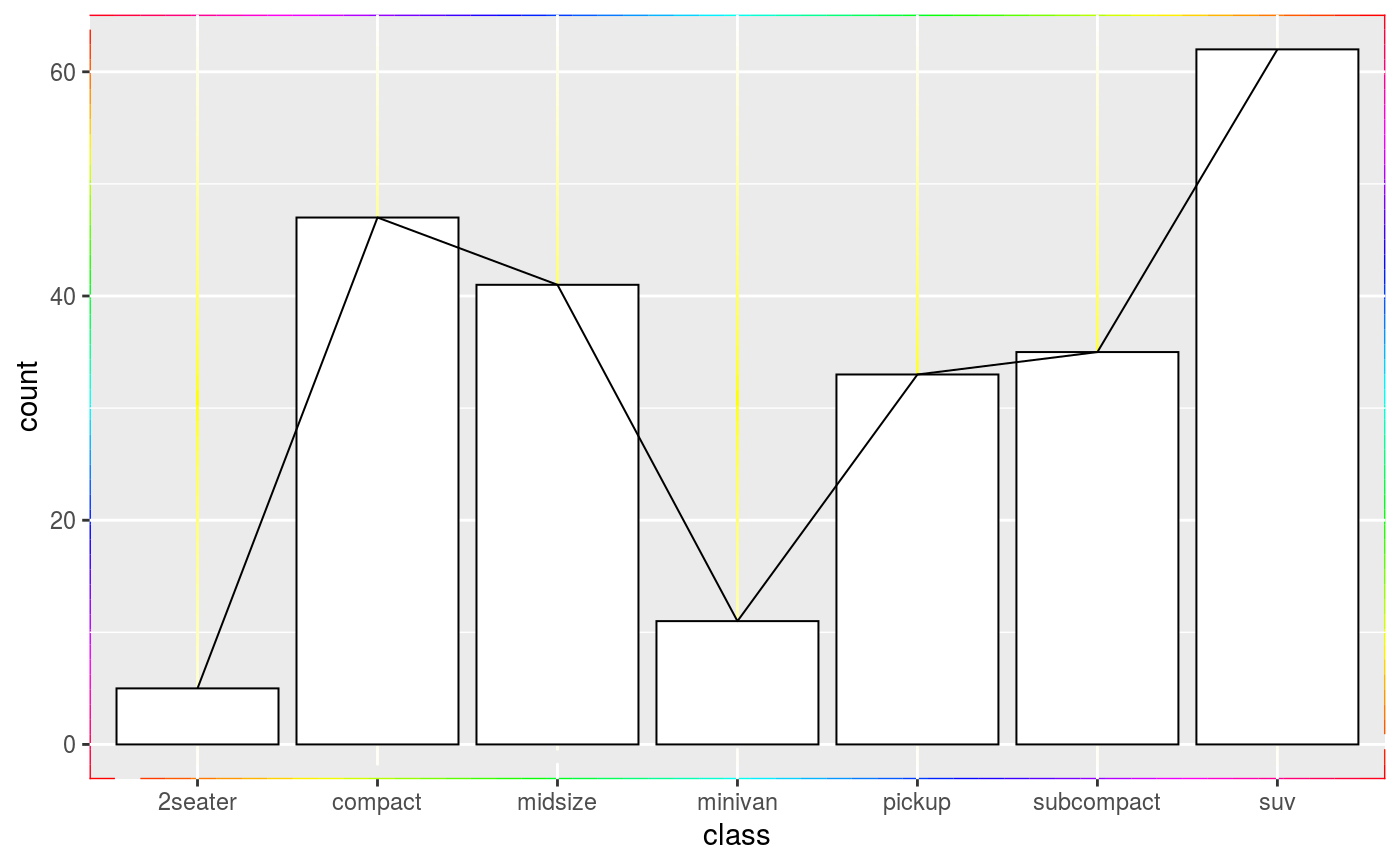
Examples
barplot <- ggplot(mpg, aes(class)) + geom_bar_theme() + geom_line_theme(stat = "count", aes(group = -1)) # Making multicolour geoms barplot + multicolour_geoms(colour = c("#00E6FF", "#2ABEFF", "#CF77F0", "#FD006A"))# Making only line geoms multicolour barplot + theme(elementalist.geom_line = element_line_multicolour(c("magenta", "yellow")))# Making only rect geoms multicolour barplot + theme(elementalist.geom_rect = element_rect_multicolour(rainbow(50)))# Let other theme elements be multicolour barplot + theme( panel.grid.major.x = element_line_multicolour(colour = c("white", "yellow", "white")), panel.background = element_rect_multicolour(colour = rainbow(50)) )